
Figures & data
Figure 1. Government debt share to GDP in South Africa.
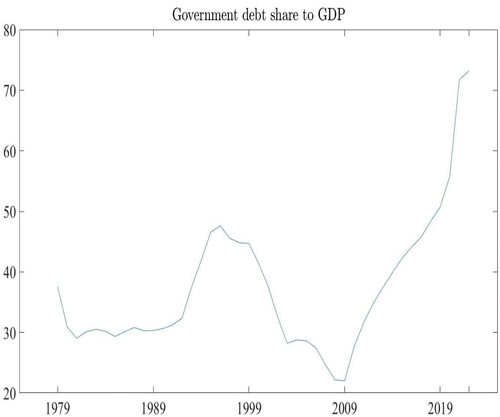
Table 1. Economic variables used
Table 2. Descriptive statistics of the data sourced and estimated
Table 3. Markov-switching dynamic regression from 1979 to 2022
Figure 2. The regime 1 to 3 filter transition probabilities. Note the economic variables domestic government debt
,
, and
, are the government debt transition probabilities from state 1 to 3. Note the state is used interchangeably with the regime. The
and
, are the average mean of the domestic government debt from state 1 to 3. A state will run for a specific period; therefore, the model can generate the mean or average.
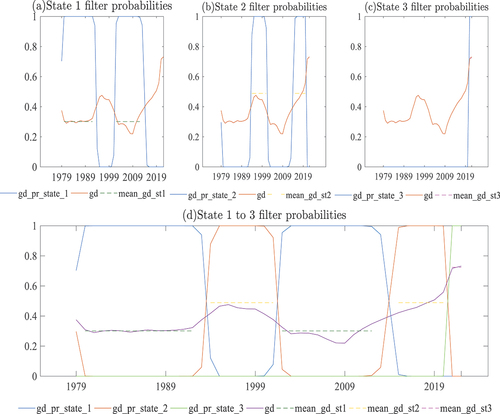
Figure 3. Transition probabilities for domestic government debt regimes. Note the state is used interchangeably with the regime.
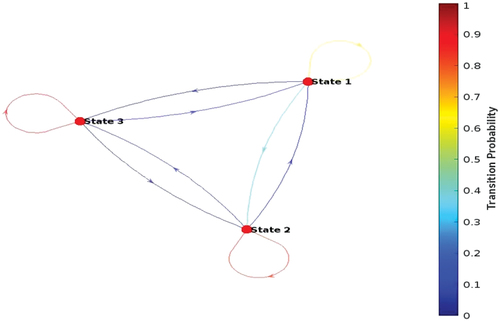
Table 4. Expected duration