
Figures & data
Figure 1. Graphical representation of monthly prices/index and returns of cryptos and uncertainties.
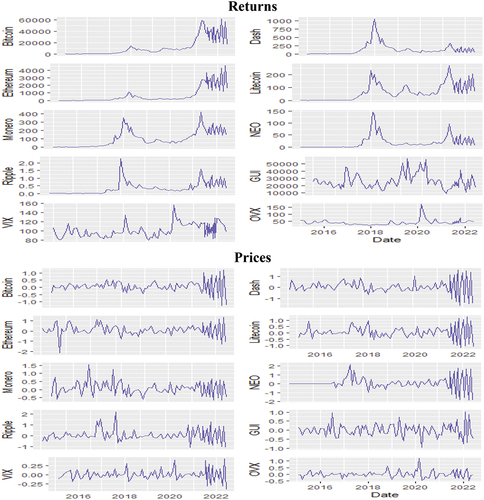
Table 1. Descriptive statistics and preliminary analysis
Table 2. Correlation matrix of global uncertainties and cryptocurrencies
Table 3. OLS regression estimation results for crypto-uncertainty nexus
Table 4. Nexus between cryptocurrencies and global uncertainty via quantile regression
Table 5. Nexus between cryptocurrencies and global uncertainty with VIX and OVX as control variables
Table 6. Crypto-GU estimations via QQR
Figure 2. Line-based visualisation of QR and QQR projections (cryptos-GU nexus)s.
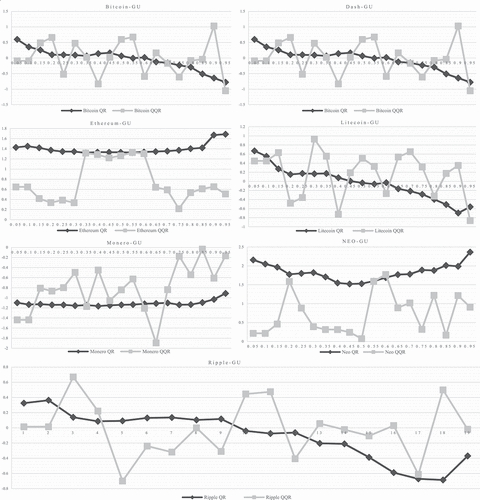
Table 7. Results of Residual-based LaGrange multiplier (LM) autocorrelation test for QR
Figure 3a. Causality-in-mean test.
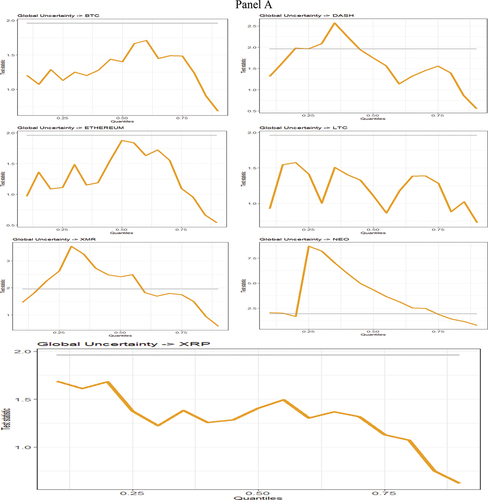
Figure 3b. Causality-in-variance test.
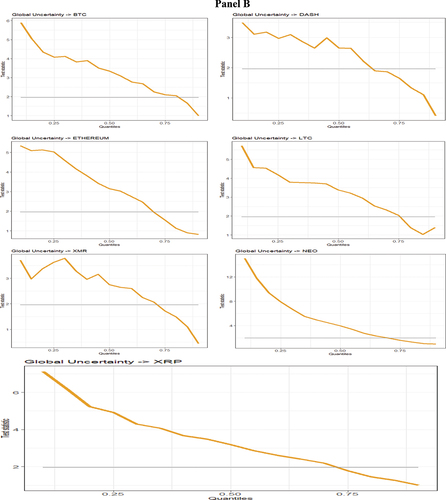
Table 8. Results of causality in mean and variance test
