
Figures & data
Figure 1. The participation status of rural women in wild honey hunting from the study area.
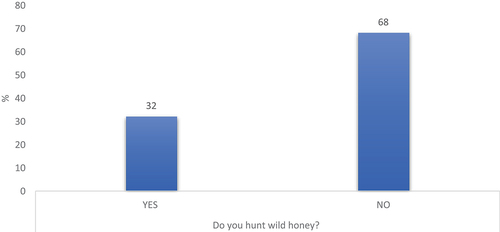
Figure 2. The distribution of the participants’ household dietary diversity scores (wild honey hunters and non-hunters) from the study area.
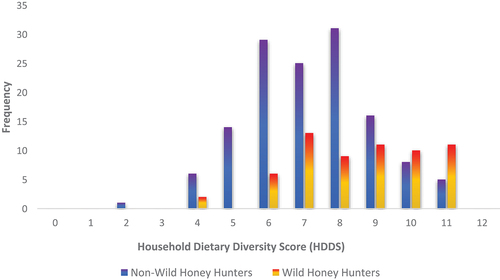
Figure 3. The distribution of the participants’ household food insecurity access scales frequencies (wild honey hunters and non-hunters) from the study area.
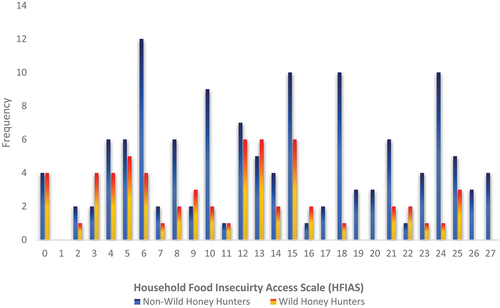
Table 1. Probit regression estimates for the factors that influence wild honey hunting among rural women
Figure 4. Propensity score distribution and the common support condition for the wild honey hunters (treatment group) and non-hunters (control group).
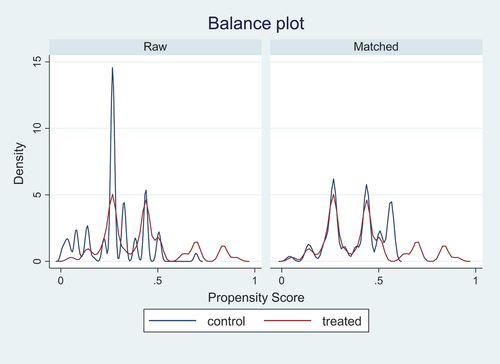
Table 2. Income, dietary diversity, and food insecurity access implications of participating in wild honey hunting