
Figures & data
Figure 1. Evolution of microfinance in Ghana.
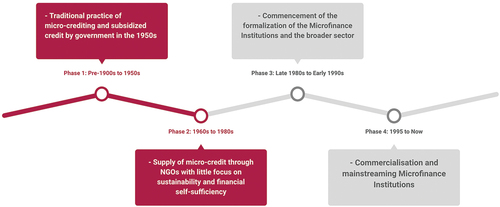
Table 1. Financial sector statistics, Share and asset value
Figure 2. Conceptual framework on the determinants of capital adequacy of MFIs.
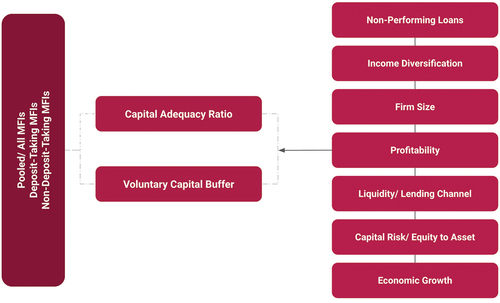
Table 2. Description of variables
Table 3. Descriptive statistics – pooled, deposit-taking and non-deposit-taking MFIs
Table 4. Correlation and variance inflation factor
Figure 3. Determinants of capital adequacy ratio among deposit-taking microfinance firms.
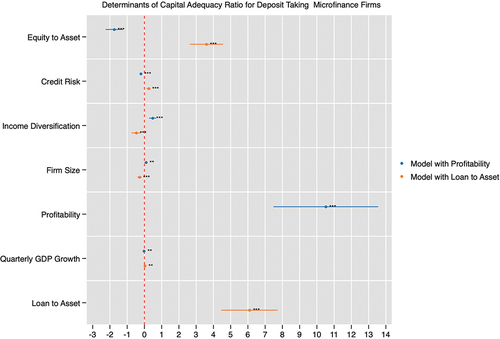
Figure 4. Determinants of capital adequacy ratio among non-deposit-taking microfinance firms.
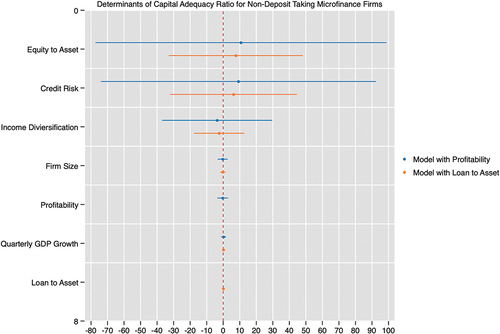
Table 5. Determinants of capital adequacy of microfinance institutions—ROA model
Table 6. Determinants of capital adequacy of microfinance institutions—LOTA model
Figure 5. Interaction of profitability and equity to total assets on capital adequacy.
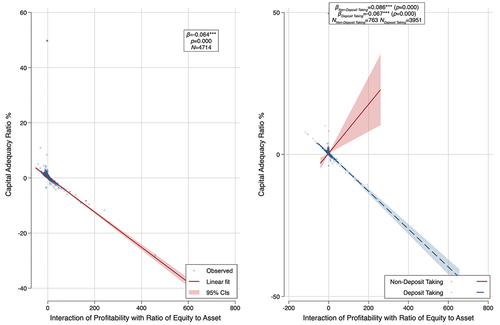
Table 7. Determinants of voluntary capital buffer (ROA model)
Table 8. Determinants of voluntary capital buffer (LOTA model)
Table 9. Voluntary capital buffer by deposit-taking and non-deposit-taking MFIs (ROA model)
Table 10. Voluntary capital buffer by deposit-taking and non-deposit-taking MFIs (LOTA model)
Public Interest Statement.docx
Download MS Word (14.3 KB)Author Biographies.docx
Download MS Word (13.3 KB)Disclosure statement.docx
Download MS Word (12.6 KB)Data availability statement
Data is available upon reasonable request.