
Figures & data
Figure 1. Time series forecasting tools used in the study.
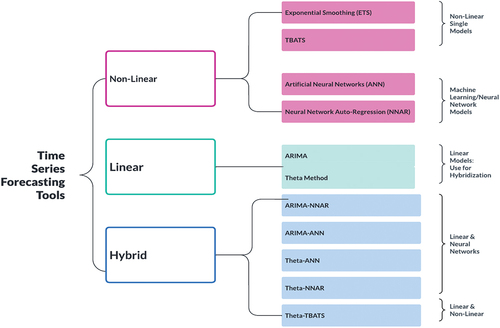
Figure 2. Time series plot of log GST data: this time series plot displays the log of the GST in constant prices, also known as the log GST data. Y-axis = the logGST, X-axis= Time.
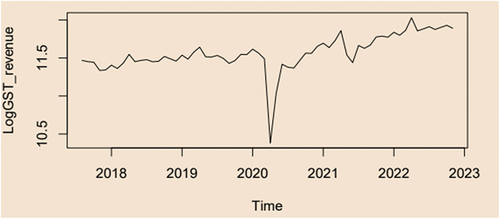
Table 1. Test for non-linearity and p-value
Figure 3. RMSE plot for all nine models.
Note. X-axis: Forecast Horizon; Y-axis: RMSE Value.
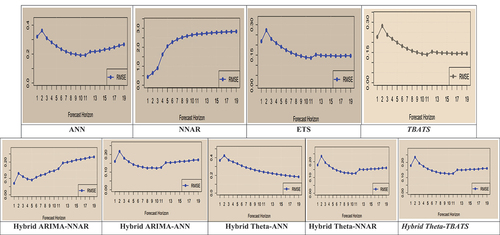
Table 2. Model validation of log GST data of India
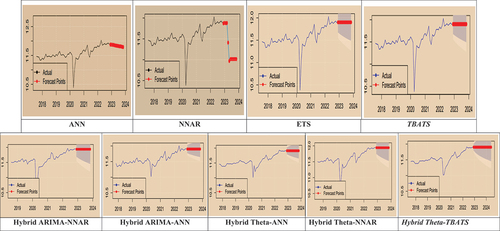
Figure 4. Actual vs 12-month forecasts data points for all nine models.
Note. X-Axis: Year and Y-Axis: LogGST Revenue.
Supplemental material
About Authors Profile.docx
Download MS Word (378.3 KB)Data availability statement
Data is available upon request.