
Figures & data
Figure 1. Comparison of the GPR index (plotted on a log scale) with the economic policy uncertainty (EPU) index constructed by Baker et al. (Citation2016).
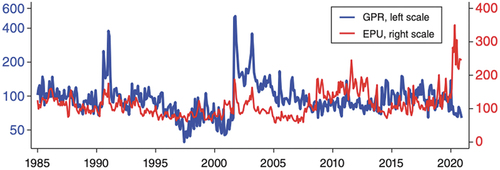
Table 1. The structure of panel data by country
Table 2. Descriptive statistics of variables
Table 3. Fisher-type unit-root test
Figure 2. Graph of the eigenvalue (stability - GPR, stability – GPR - EPU).
Table 4. Pedroni test for cointegration
Table 5. Estimation result of the PVAR models: stability
Figure 3. IRF of stability, GPR for panel A.
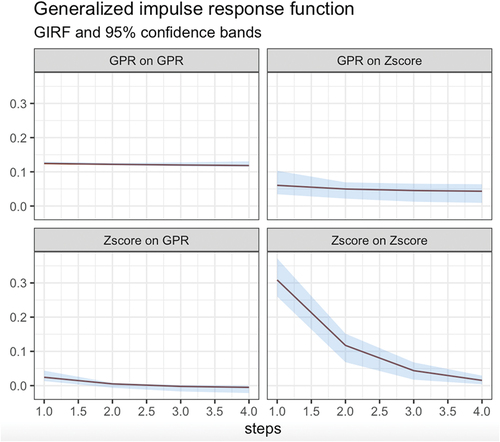
Figure 4. IRF of stability, GPR for panel B.
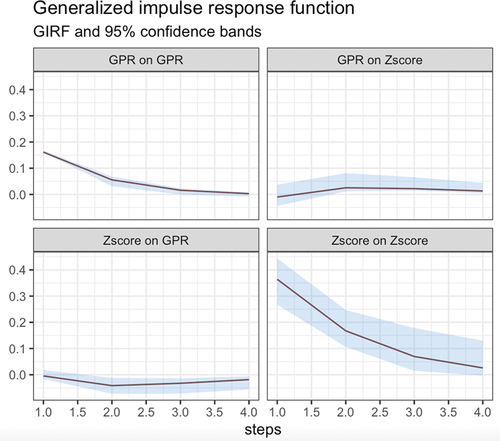
Figure 5. IRFs of stability, GPR, EPU for panel A.
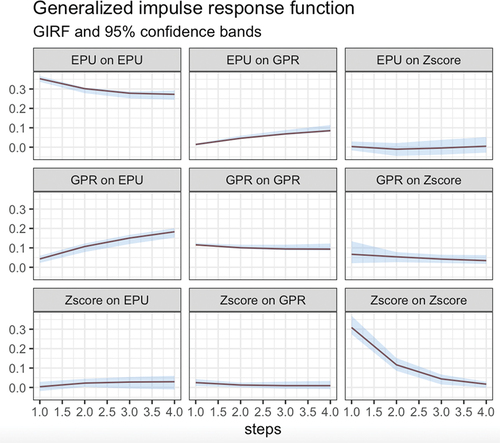
Figure 6. IRFs of stability, GPR, EPU for panel B.
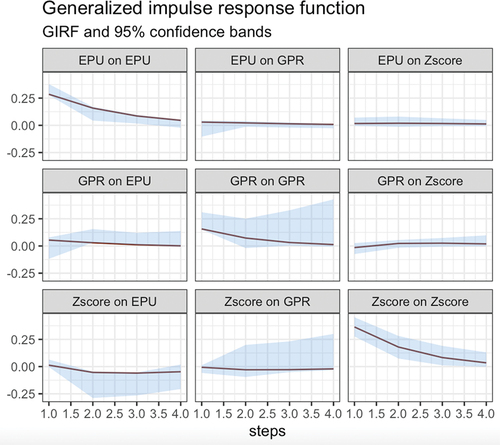
Table 6. Estimation result of the PVAR models: stability
Figure 7. Impulse response of stability, GPR*EPU for panels A and B.
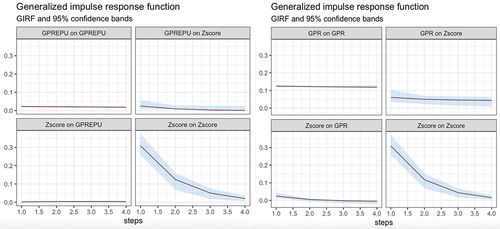
Table 7. Definitions of variables
Table 8. Result of bank stability sys-GMM model