
Figures & data
Figure 1. Daily number of job loss and number of COVID-19 new cases.
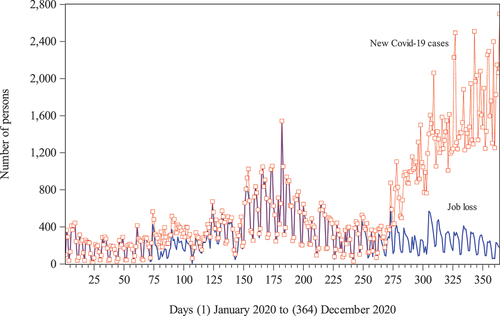
Figure 2. Daily number of job loss and number of COVID-19 new deaths.
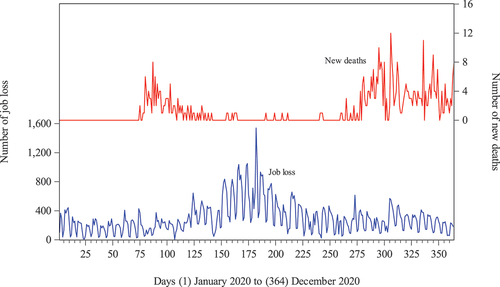
Figure 3. Daily log and log changes in number of job loss, number of COVID-19 new cases and new deaths.
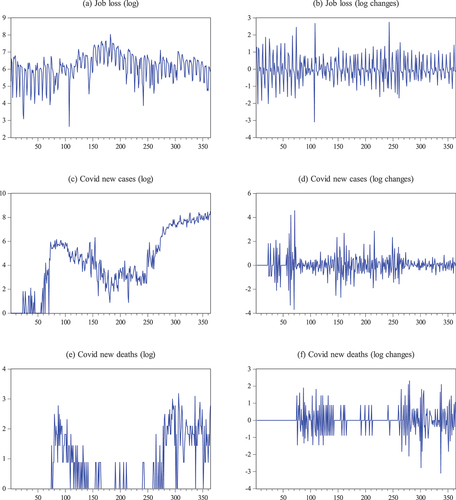
Figure 4. Q-Q plots of log job loss, COVID-19 new cases and new deaths, and log changes in loss of employment, COVID-19 new cases and new deaths.
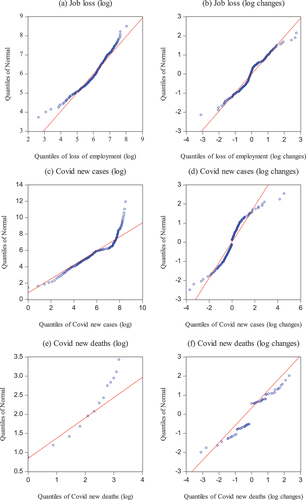
Figure 5. Q-Q plot of job loss regression residuals.
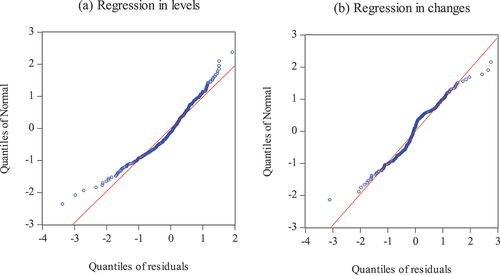
Table 1. Descriptive statistics
Table 2. Regression estimates for loss of employment with COVID-19 new cases and new deaths
Table 3. Results of unit root tests
Table 4. Results of cointegration tests
Table 5. Parameter estimates of ARDL(3,3,0)-GARCH(1,1)-M and ARDL(3,3,0)-EGARCH(1,1)-M
Table 6. Parameter estimates of ARDL(3,3,0)-TGARCH(1,1)-M and ARDL-PGARCH(1,1)-M
Table 7. Evaluation of in-sample and out-of-sample forecasting for (log) loss of employment