
Figures & data
Table 1. The circular economy’s implementation of sustainability aspects.
Table 2. Measurement variables.
Figure 1. Research model. Source: The authors (2022).
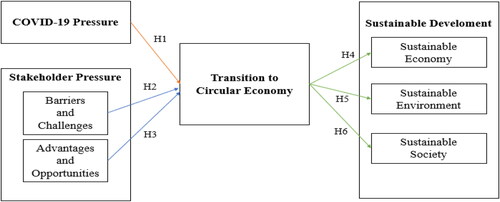
Table 3. Demographic statistics.
Figure 2. Model examing the linkage between the COVID-19 pandemic, stakeholder pressure, and the transition to a circular economy for sustainable development. Source: The authors (2022).
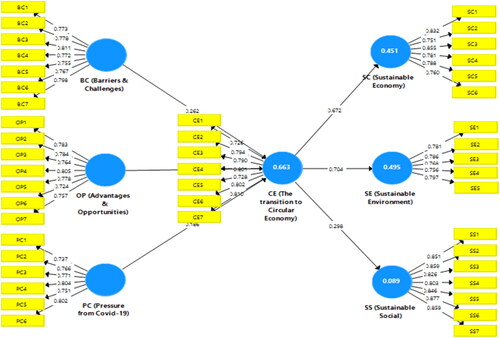
Table 4. Construct reliability and convergent validity.
Table 5. HTMT for discriminant validity.
Table 6. Path coefficient.
Table 7. SEM-multi-group analysis (MGA).
Table 8. Hypothesis testing results.
Table A1. Using the following scale, please select only one answer that best reflects your opinion about the statement. 5 = Strongly Agree, 4 = Agree, 3 = Neutral, 2 = Disagree, 1 = Strongly Disagree.
Data availability statement
The data that support the findings of this study are available from the corresponding author, [Manh Hung Pham], upon reasonable request.