
Figures & data
Table 1. The variable definition.
Figure 1. The Annual report readability.
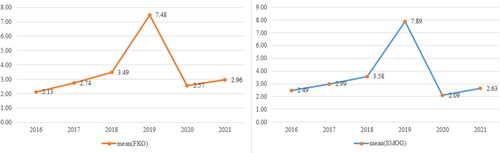
Table 2. Descriptive variables – the indicators (FKG and SMOG) of annual report readability.
Table 3. Descriptive variables – firms’ characteristics – control variables of the model.
Table 4. The result of regressions – FEM, REM an DGMM models: Estimation of the relationship between measures of readability (FKG, SMOG) and firms’ investments.
Table 5. Quantile regression.