
Figures & data
Table 1. Summary statistics (N = 656).
Table 2. Measures of housing affordability and their components (US$/month).
Figure 1. Housing tenure by income quintiles.
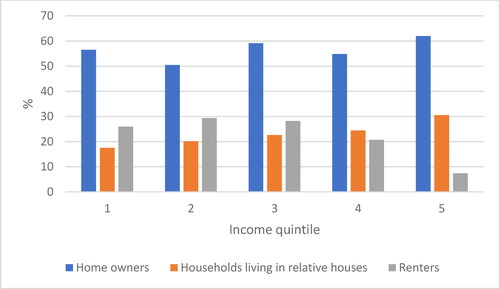
Table 3. Housing consumption and expenditure by income quintiles.
Figure 2. Lorenz curve for housing expenditure (panel a and b) and consumption (panel c and d).
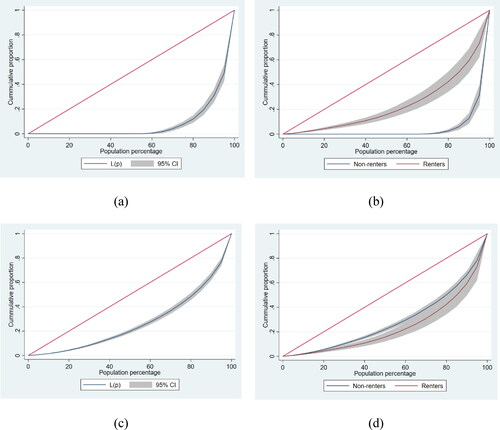
Table 4. Regression results for housing consumption and expenditure.
Data availability statement
The dataset is owned by the funder, and its availability is subject to the funder’s discretion.