Figures & data
Figure 1. Nifty 50 index annual return (in %) is plotted against the foreign institutional investment in million US$.
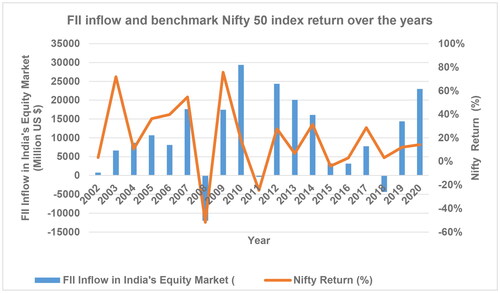
Figure 2. India’s real GDP growth rate is plotted against the foreign institutional investment in million US$.
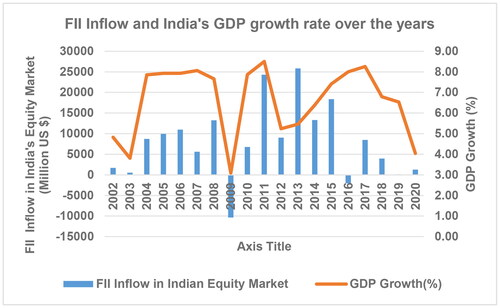
Table 1. Descriptive statistics of variables used in the study.
Table 2. Result of Mood’s Median test.
Table 3. Correlation matrix.
Table 4. Result of panel fixed effect model.
Table 5. Results of panel fixed-effect model with crisis dummy variable using EquationEqs. (5)(5)
(5) and Equation(6)
(6)
(6) .
Table 6. Panel quantile analysis of the impact FII on CR1 and CR2 after controlling for size and leverage.
Figure 3. Impact of FII holding across the quantiles of CR1 and CR2.
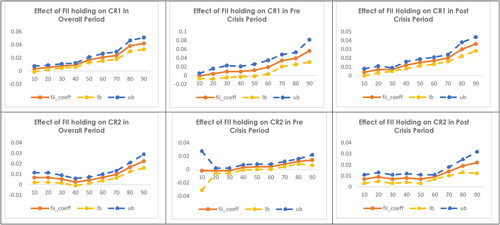
Table 7. Panel quantile analysis of the impact FII on CR1 and CR2 after controlling for industry effect, liquidity, firm age, public holding, size and leverage.
Figure 4. Impact of FII holding across the quantiles of CR1 and CR2 after controlling for size, liquidity, age, leverage, public shareholding and industry effect.
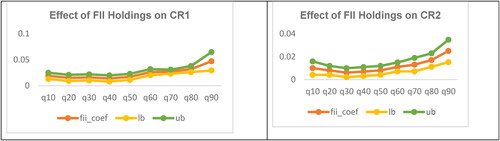
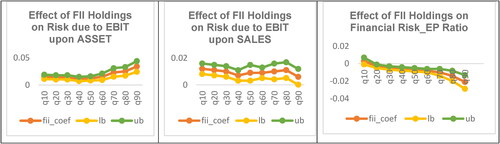
Table 8. Panel quantile analysis of the impact FII on EBIT_Sales and EBIT_Asset as a proxy for business risk and EPRatio as proxy for financial risk after controlling for industry effect, liquidity, firm age, public holding, size and leverage.
Figure 5. Impact of FII holding across the quantiles of EBIT/Asset, EBIT/Sales and EP Ratio after controlling for industry effect.