
Figures & data
Figure 1. Trade openness and GDP growth rate of Somalia from 1990 to 2020. Sources: UNTCAD (2020) and SESRIC (2020).
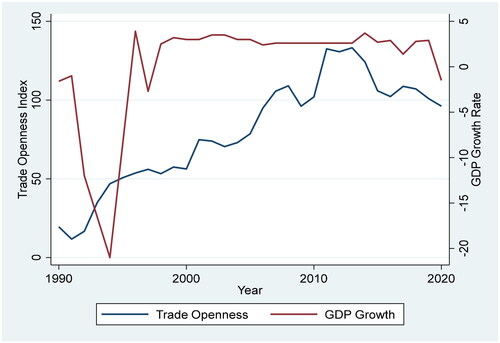
Table 1. Descriptive information and correlation matrix.
Table 2. Unit root tests.
Table 3. Nonlinearity of BDS test.
Table 4. F-bounds test.
Table 5. Long-run coefficient estimates.
Table 6. Short-run dynamic effect and error correction model.
Figure 2. Model stability CUSUM test and CUSUM square test.
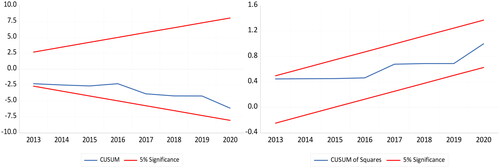
Table 7. Diagnostic tests.
Figure 3. Dynamic multiplier effect graphs.
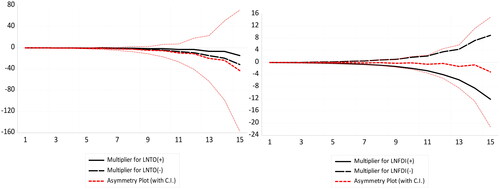
Table 8. Johansen cointegration test.
Table 9. VECM causality tests.
Data availability
The datasets used and/or analyzed during the current study are available from the following links: https://data.worldbank.org/indicator/SL.TLF.TOTL.IN?locations=SO; https://www.sesric.org/query.php; and https://unctadstat.unctad.org/wds/TableViewer/dimView.aspx.