
Figures & data
Table 1. FDI trend from 2010 to 2020.
Figure 1. FDI stock and percentage of gross fixed capital formation.
Source: UNCTAD cited JICA (Citation2022).
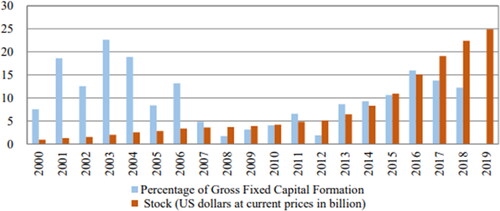
Figure 2. Projects created by operational projects, broken down by status and employment.
Source: Ethiopian Investment Commission (1992–2020).
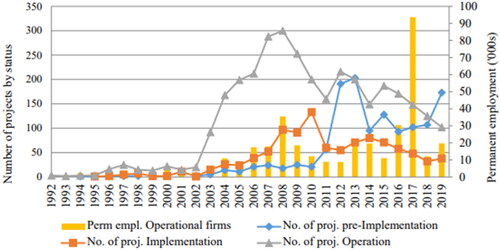
Table 2. FDI projects by sector and status (1992–2021).
Table 3. FDI flow in Ethiopia during the onset of conflict.
Table 4. World Bank doing business 2021.
Availability of data and materials
Data and material would be made available upon request.