
Figures & data
Figure 1. Evolution of GFCF as a percentage of GDP of WAEMU countries.
Source: Authors, with African Development Bank statistics.
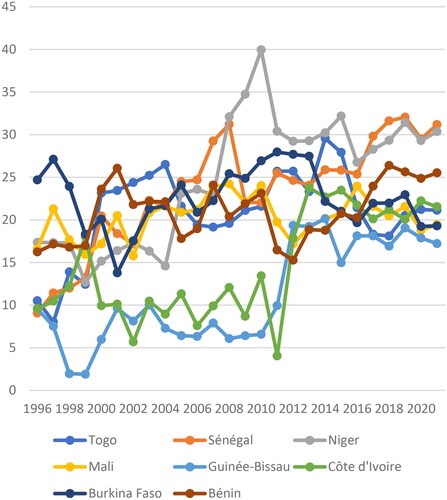
Figure 2. Evolution of the standard deviation and the average deviation of GFCF as % of GDP of WAEMU countries.
Source: Authors, with African Development Bank statistics.
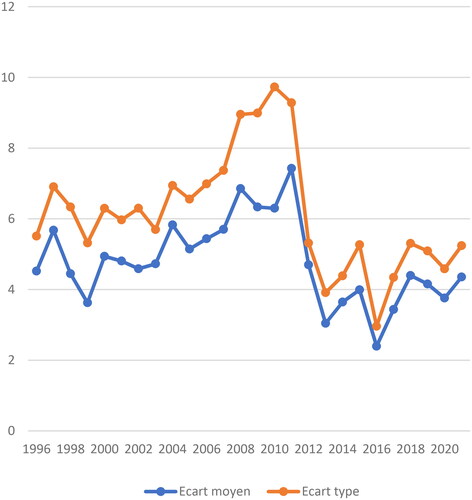
Figure 3. Total population of WAEMU countries from 1996 to 2021.
Source: Authors, with African Development Bank statistics.
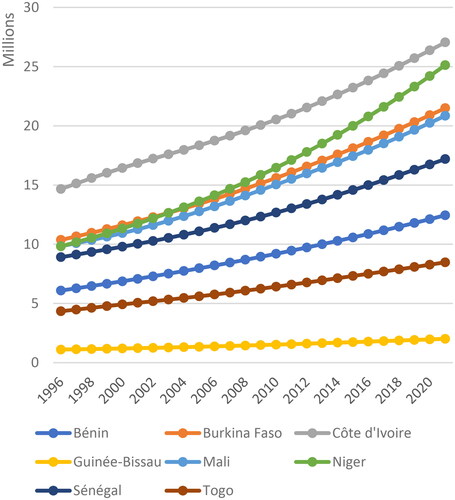
Figure 4. Standard deviation and the average deviation of the total population of the WAEMU countries.
Source: Authors, with African Development Bank statistics.
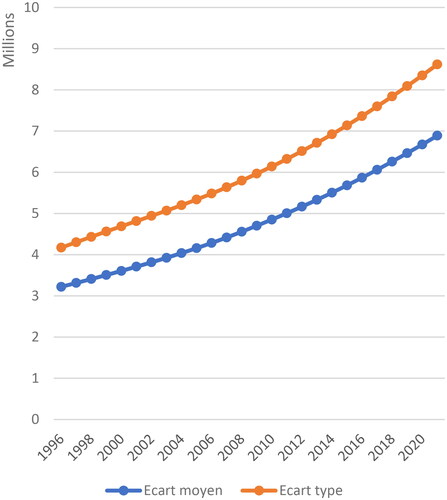
Figure 5. GDP per capita of the WAEMU countries.
Source: Authors using Data from the African Development Bank.
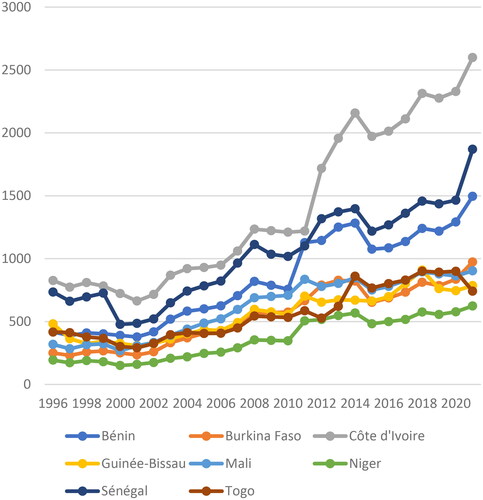
Figure 6. Standard deviation and the average deviation of GDP per capita of the WAEMU countries.
Source: Authors using Data from the African Development Bank.
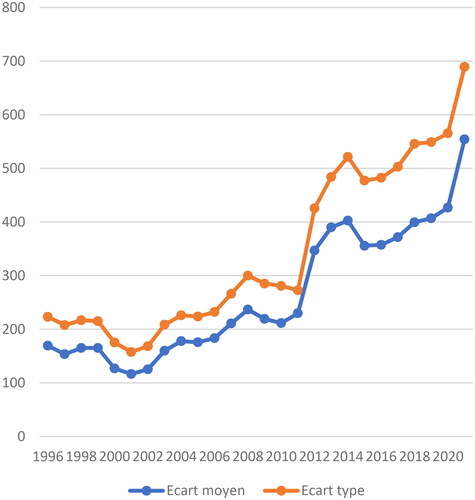
Figure 7. Real GDP per capita growth rate in WAEMU.
Source: Authors, with African Development Bank statistics.
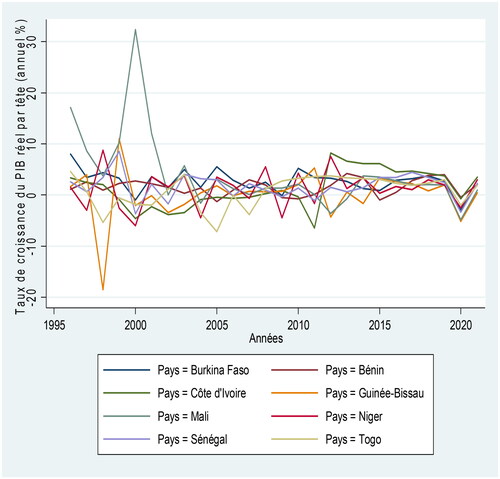
Figure 8. Standard deviation of real GDP per capita growth rate in WAEMU.
Source: Authors, with African Development Bank statistics.
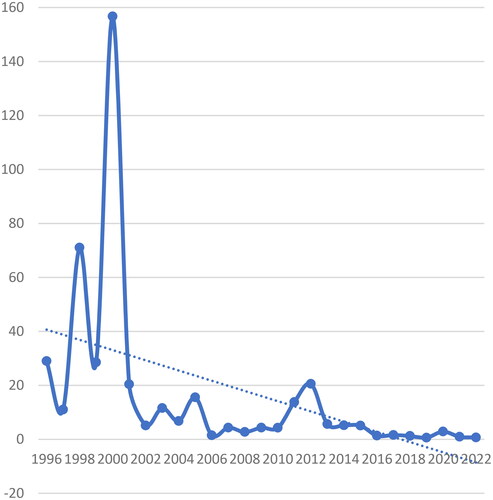
Figure 9. Relationship between real GDP per capita growth rate and GDP per capita9.
Source: Authors using AfDB data.
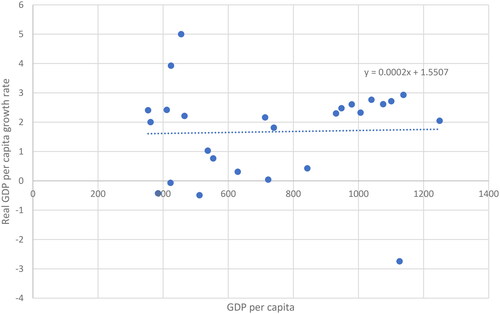
Table 1. Results of estimates.
Figure A1. Evolution of the Real GDP per capita growth rate of the WAEMU countries.
Source: Authors using data from the African Development Bank.
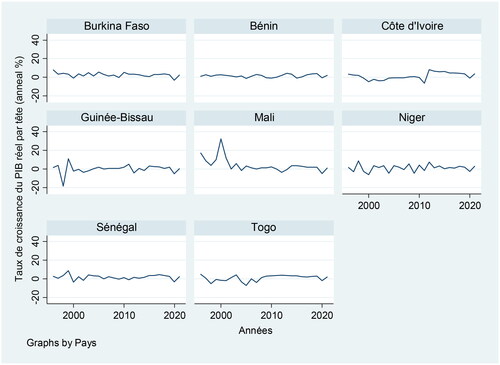
Figure A2. Evolution of the (Boyle and McCARTHY, Citation1999).
Source: Authors using AfDB data.
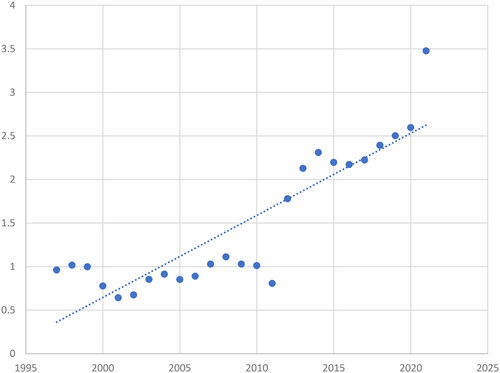
Table A1. Databases for control estimates.
Table A2. Summary statistics of study variables.
Table A3. Results of estimates.
Data availability statement
The data supporting the findings of this study are available from the corresponding author upon reasonable request.