
Figures & data
Figure 1. The trend of CO2 emissions (measured by emissions per capita) in ECOWAS from 1990 to 2019.
Source: Figure created by Author.
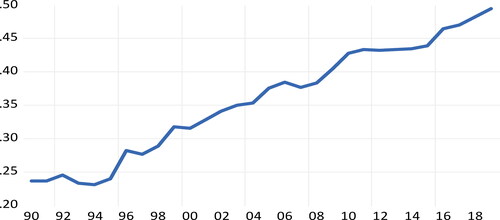
Table 1. Descriptive statistics and pairwise correlation matrix.
Figure 2. Scatter plots of the lower triangular matrix.
Source: Figure created by Author.
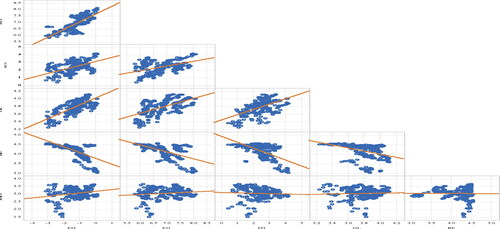
Figure 3. Trends of variables employed in the analysis.
Source: Figure created by Author.
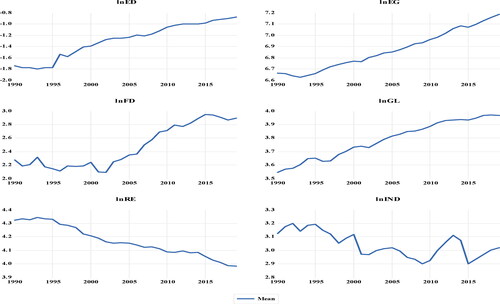
Table 2. Cross-sectional dependency test results.
Table 3. Outcome of slope coefficient homogeneity test.
Table 4. Panel unit root tests.
Table 5. Results of panel cointegration tests.
Table 6. Regression with Driscoll-Kraay standard errors and average marginal effects.
Figure 4. N-shaped EKC for the ECOWAS region.
Source: Figure created by Author.
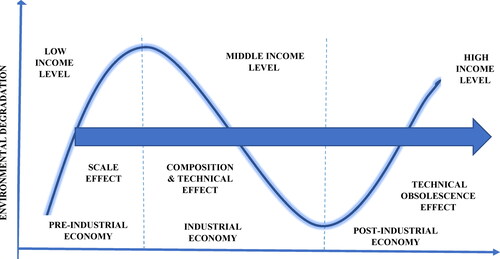
Table 7. U test estimation results.
Table 8. Outcome of panel quantile analysis.
Availability of data and materials
In this investigation, we exclusively used secondary data from public sources. Therefore, in this study, no new data is used or produced.