
Figures & data
Figure 1. Rolling correlation between the natural logarithms EEE and volatility (1999 to 2017).
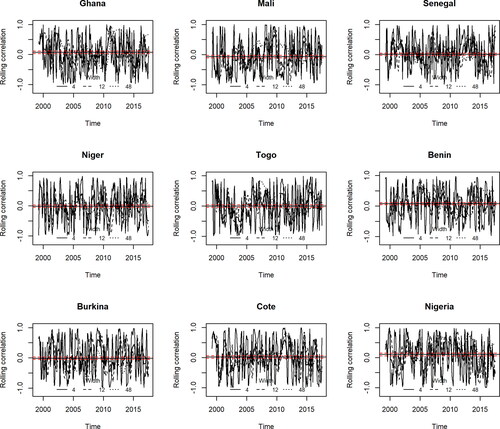
Figure 2. ECOWAS-Eurozone exports in million dollars (1999 to 2017).
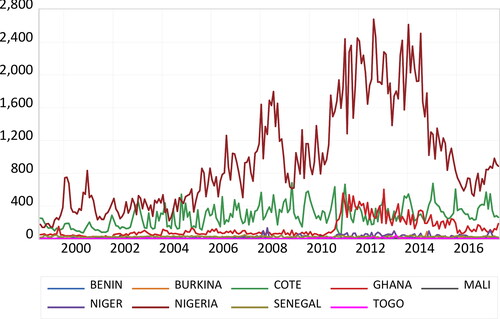
Figure 3. Bar chart for the total ECOWAS-Eurozone exports in million dollars (1999 to 2017).
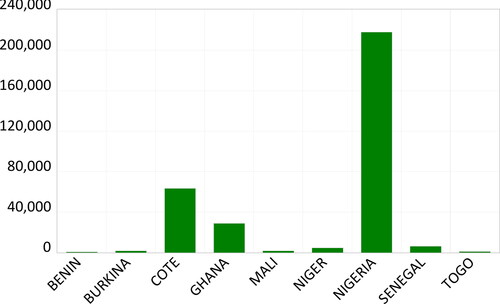
Figure 4. Pie chart for the total ECOWAS-Eurozone exports in million dollars (1999 to 2017).
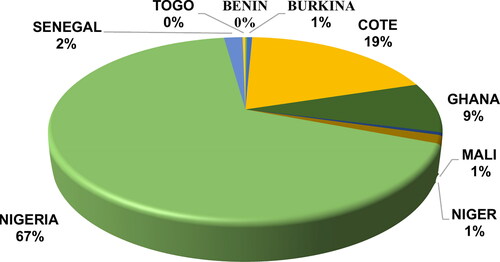
Figure 5. Network graph of literature on exchange rate volatility based on author keywords.
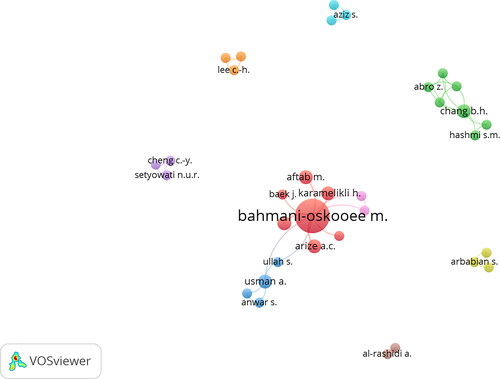
Figure 6. Network graph of literature on exchange rate volatility by author.
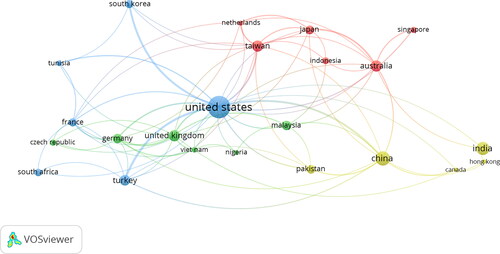
Figure 7. The architecture of the GARCH estimate (source: authors).
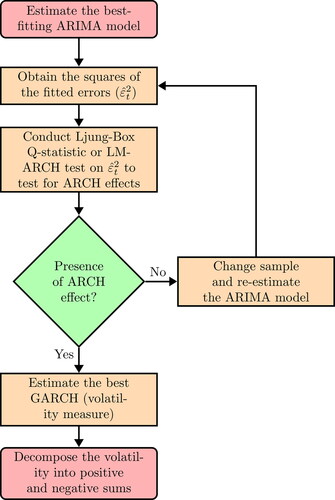
Table 1. Mean and variance equations of the GARCH.
Table 2. F-statistic of cointegration relationship.
Table 3. Short run estimates of the NARDL.
Table 4. Model selection and diagnostic tests.
Table 5. Long-run estimates of the NARDL.