
Figures & data
Figure 1. Average holding of public securities in the WAEMU (%). Source: Authors, bank balance sheet data 2000–2019 (BCEAO).
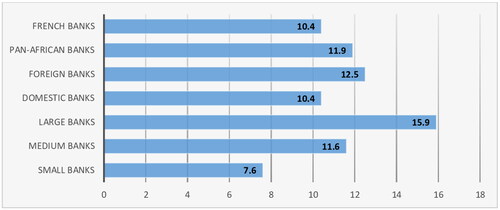
Figure 2. Breakdown of outstanding government securities by issuer (auctions) in Q3 2023 (in billions of XOF). Source: Authors, UMOA-Titres.
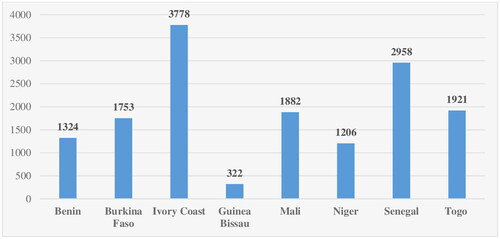
Table 1. Standard statistics (multiple imputation method).
Table 2. Interindividual dependency test.
Table 3. Pesaran (Citation2007) unit root test.
Table 4. Optimal delay of the VAR panel model.
Table 5. Estimation of the PVAR model using the GMM.
Table 6. Variance decomposition of forecast error (%).
Figure 3. IRFs for all WAEMU banks. Source: Authors, based on BCEAO and World Bank data.
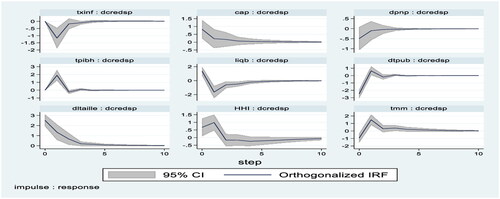
Figure 4. Responses of government securities and credit channel variables to a shock to bank liquidity. Source: Authors, based on BCEAO and World Bank data.
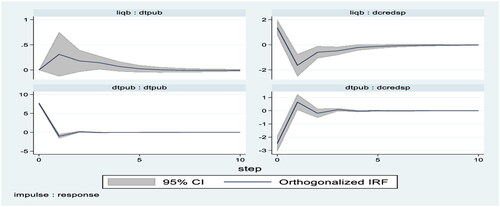
Figure 5. IRF, large banks. Source: Authors, based on BCEAO and World Bank data.
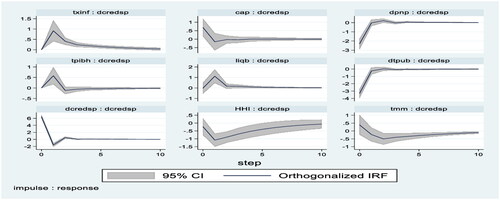
Figure 6. IRF, medium banks. Source: Authors, based on BCEAO and World Bank data.
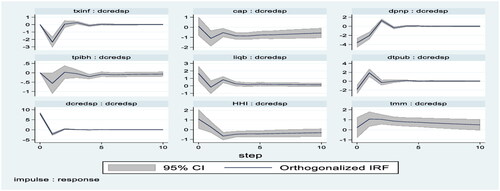
Figure 7. IRF, small banks. Source: Authors, based on BCEAO and World Bank data.
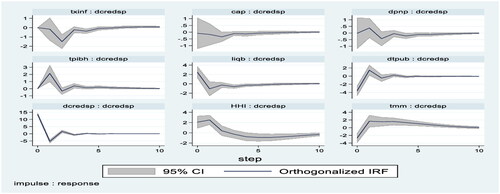
Figure 8. IRF, domestic banks. Source: Authors, based on BCEAO and World Bank data.
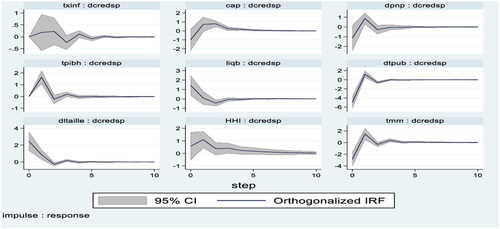
Figure 9. IRF, foreign banks. Source: Authors, based on BCEAO and World Bank data.
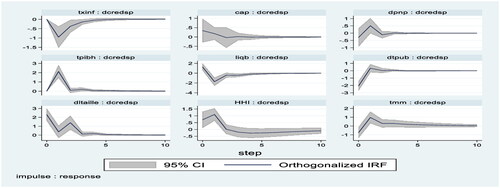
Figure 10. IRF, pan-African banks. Source: Authors, based on BCEAO and World Bank data.
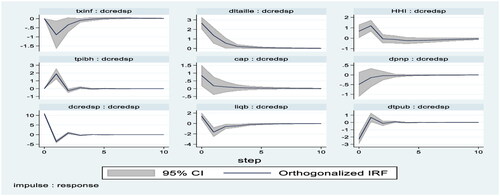
Figure 11. IRF, French banks. Source: Authors, based on BCEAO and World Bank data.
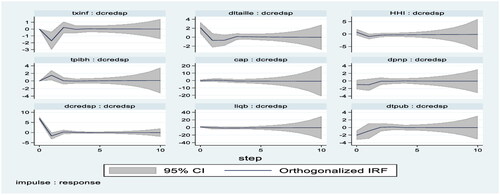
Table 7. Robustness of the PVAR estimation results.