
Figures & data
Figure 1. Evolution of FDI inflows in developing countries, 1970–2021.
Source: UNCTAD (Citation2023).
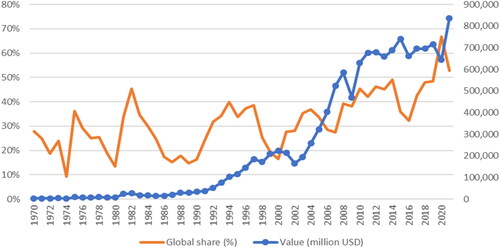
Table 1. Variables measurement and expected signs.
Table 2. Variables description.
Table 3. Correlation matrix.
Table 4. Panel unit root tests.
Table 5. Regression estimation results.
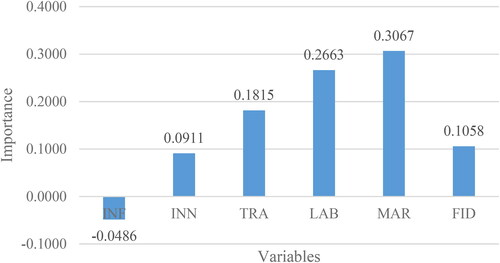
Figure 2. Contribution of explanatory variables on FDI.
Source: Authors’ work.
Supplemental material
Supplemental Material
Download MS Excel (108.8 KB)Data availability statement
The data have been deposited in the Mendeley data repository at the following link: https://data.mendeley.com/datasets/s7brrc9b63/3
