
Figures & data
Table 1. Demographic characteristics and results of a test of mean differences by gender of plot manager.
Figure 1. Distribution of total cereals harvested and total cereals harvested by an acre of land by gender. Source: 3rd wave of Ghana Socioeconomic Panel Survey.
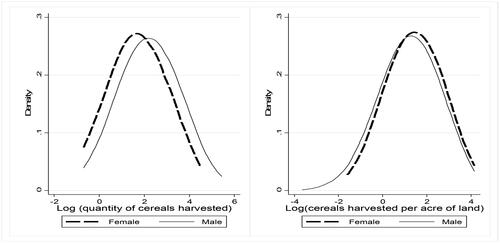
Figure 2. Distribution of total maize, millet, and rice harvested and total maize, millet, and rice harvested by an acre of land by gender. Source: 3rd wave of Ghana Socioeconomic Panel Survey.
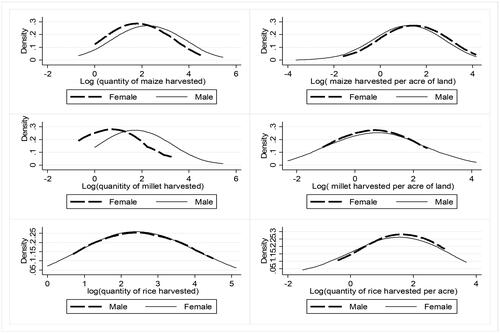
Table 2. Plot-level characteristics and results of a test of mean differences by gender of plot manager.
Table 3. OLS results on gender productivity of cereal growers in rural Ghana.
Table 4. Decomposition of the gender differential in the productivity of cereal farmers.
Table 5. Decomposition of the gender differential in productivity at various percentiles.
Data availability statement
The datasets analysed during the current study are available in the Yale Economic Growth Center, and the web link for the dataset is https://www2.statsghana.gov.gh/nada/index.php/catalog/97.
