
Figures & data
Figure 1. Effect of financial development on investment growth. Data source: International Bank.
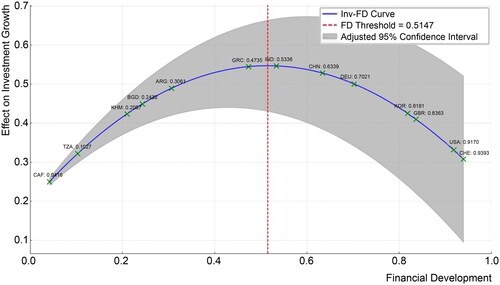
Figure 2. Scatter plot of GNI per capita and financial development by income group. Data source: International Monetary Fund, World Bank.
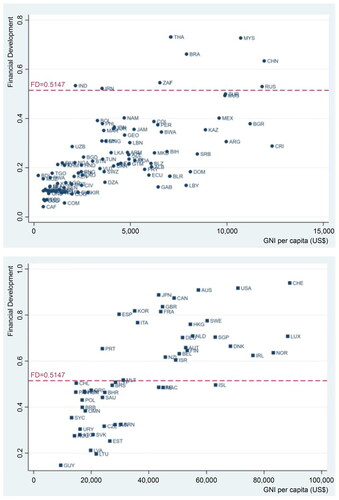
Table 1. Description of variables.
Table 2. Panel unit root tests results.
Table 3. Kao residual panel cointegration results.
Table 4. Empirical results for the basic model.
Table 5. Empirical results for short and long run effects.
Table 6. Empirical results by income group.
Table 7. Robustness test using proxy variables.
Table 8. Robustness test for short and long run effects.
Table 9. Robustness test by income group.
Public Interest Statement.docx
Download MS Word (16.1 KB)Data availability statement
The datasets generated and/or analyzed during the current study are available from the corresponding author upon reasonable request.