
Figures & data
Table 1. Variable definitions and data sources.
Table 2. Descriptive statistics of variables.
Table 3. Mean TFP and IC (level and growth) by income level and region.
Figure 1. The level of IC index across income level and time.
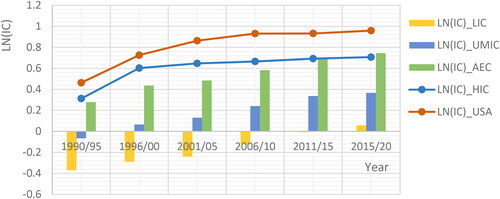
Table 4. The CD and slope homogeneity test.
Table 5. Sequential test for multiple breaks (Ditzen et al., Citation2021).
Table 6. Panel Unit Root Tests.
Table 7. Co-integration tests.
Table 8. Dynamic CCE estimation result (lntfpl as dependent).
Table 9. Dynamic CCE estimation result for 2nd model (tfp_g as dependent).
Figure 2. Graphs for sample low income countries.
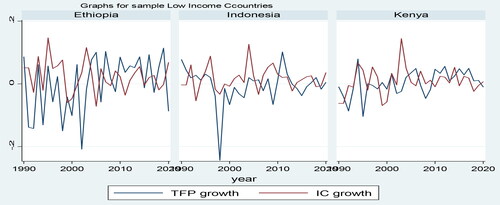
Figure 3. Graphs for sample upper middle income countries.
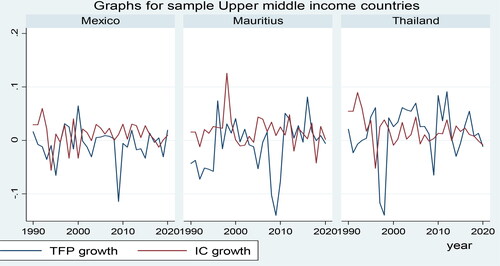
Figure 4. Graphs for sample HIC.
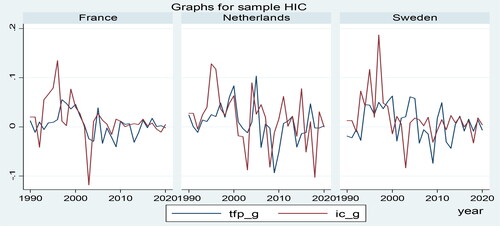
Figure 5. Shows the relationship between IC and TFP is linear after the natural log.
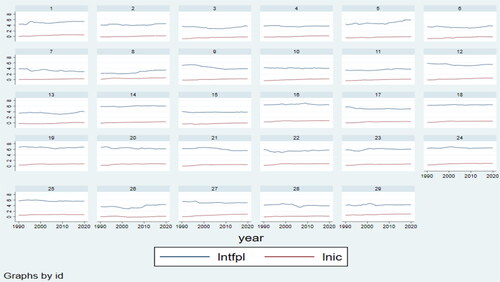
Table 10. CS-ARDL results for 10 advanced countries.
Table A1. Sample countries by income group and region.
Table A2. Compositions of intellectual capital index.
public interest.docx
Download MS Word (11.1 KB)Data availability statement
The data that support the findings of this study are openly available in figshare at 10.6084/m9.figshare.25048061.