
Figures & data
Table 1. Variable definitions and data sources.
Table 2. The CD and slope homogeneity test.
Table 3. Stationarity test.
Table 4. Mean growth of IC and output.
Figure 1. The level of IC index across income level and time.
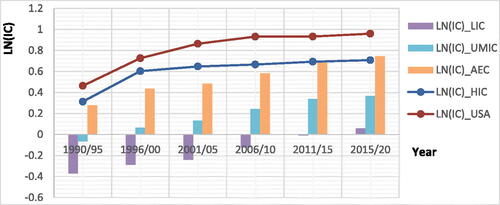
Figure 2. The growth rate of IC across income level and time.
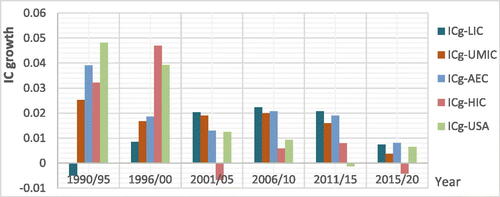
Table 5. Estimation result for output growth (y_g) as dependent variable.
Table 6. CS-ARDL result of output per worker growth (yl_g) as dependent variable.
Table A1. Sample countries by income group and region.
Table A2. Compositions of intellectual capital index.
Table A3. Conjugated terminologies.
Data availability statement
The data supporting the findings of this study are openly available in figshare at 10.6084/m9.figshare.22692550 or https://figshare.com/s/645ce6d7d0a15981ad67.