
Figures & data
Figure 1. Conceptual Framework on the use of mobiles and computers in agriculture. (Source: Authors’ conceptualization).
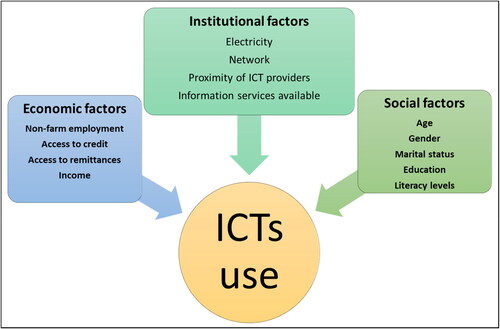
Figure 2. Map for Marondera, Zimbabwe. (Source: Dzwairo et al., Citation2006).
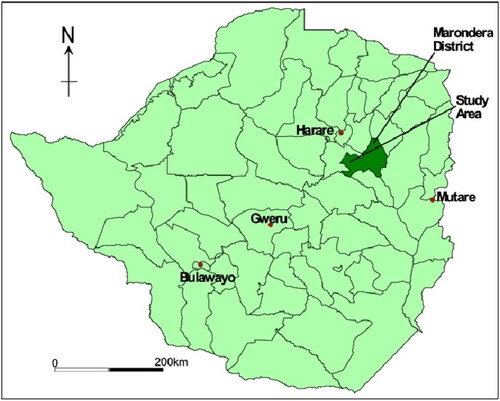
Table 1. Definitions and descriptions of variables.
Table 2. Mobile and computer use for agriculture.
Table 3. Comparison between mobile ownership and mobile use for agricultural purposes.
Table 4. Comparison between computer ownership and computer use for agricultural purposes.
Table 5. Chi-square tests of association regarding mobile use in agriculture.
Table 6. Chi-square tests of associations regarding the use of computers in agriculture.
Table 7. Challenges associated with the use of ICTs in agriculture.
Table 8. Average marginal effects showing factors affecting mobile use in agriculture.
Table 9. Average marginal effects showing the factors affecting computer use in agriculture.
Data availability statement
The data and materials supporting the results and analysis presented in this paper is readily available upon reasonable request.