
Figures & data
Table 1. CFA franc zone countries annual inflation rate (in percentage).
Table 2. Non-CFA franc zone countries’ mean annual inflation rate in percentage.
Figure 1. The evolution of GDP per capita growth during the two sub-periods: 1990–2001 and 2002–2022.
Source: Authors, based on WDI data.
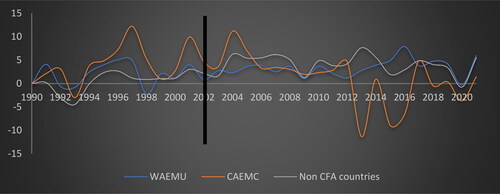
Table 3. Estimated synthetic control weights by outcome variable – real GDP per capita – for each treated country.
Table 4. The average of the Predictor of per-capita GDP before treatment for franc-CFA zone countries and pool control countries.
Figure 2. Real GDP per capita gap between actual WAEMU countries and their ‘bias-corrected’ synthetic counterparts.
Note. The gaps drawn between actual, and bias-corrected SC real GDP per capita are expressed in US$.
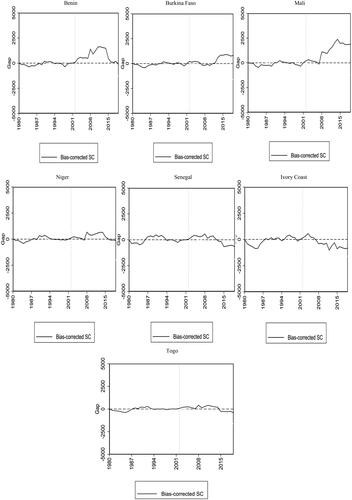
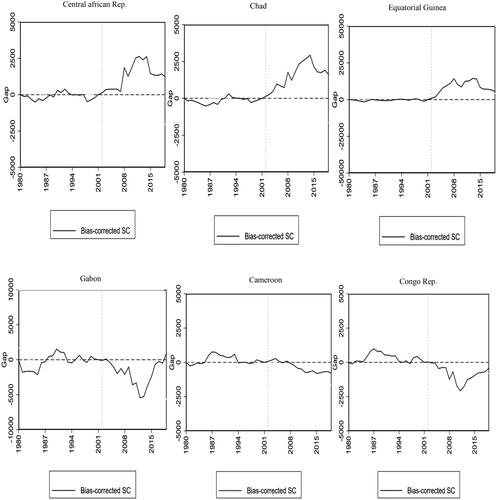
Figure 3. Real GDP per capita gap between actual CAEMC countries and their ‘bias-corrected’ synthetic counterparts.
Note 1: The gaps drawn between actual, and bias-corrected SC real GDP per capita are expressed in US$.
Appendix 1. Average Inflation volatility in CFA franc zone countries during the during the two sub-periods.
Appendix 2. Average volatility of inflation in non-CFA franc countries during the two sub-periods.
Appendix 3. Franc CFA area countries’ mean annual GDP per capita growth.
Appendix 4. Non franc CFA countries’ mean annual GDP per capita growth.
Appendix 5. Data description and sources.
Appendix 6. OLS fixed effect estimates of real GDP per capita parameters of CFA franc-zone countries.
Appendix 7. Estimated ‘bias-corrected’ SC gap and placebo gaps in WEAMU countries.
Appendix 8. Estimated ‘bias-corrected’ SC gap and placebo gaps in CAEMC countries.
Appendix 9. Robustness test, sensitivity of WAEMU country results to the highest weight.
Appendix 10. Robustness test, sensitivity of CAEMC country results to the highest weight.
Date availability statement
Data available on request from the authors.