
Figures & data
Figure 1. The USD/KSHS real exchange rate from 1990 to 2020.
Source: Central Bank of Kenya (2021).
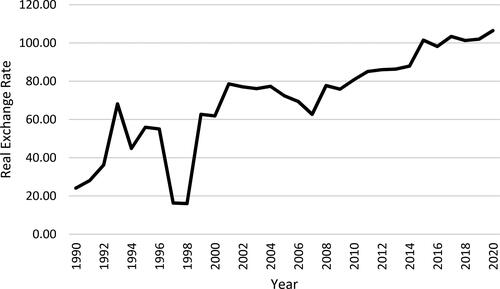
Figure 2. Trend analysis of Kenyan coffee production and exports from 1990 to 2020.
Source: International Coffee Organization (ICO, 2021).
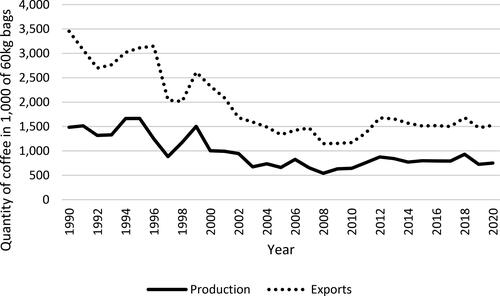
Figure 3. The exchange-rate volatility between USD/KShs from 2001 to 2020 estimated by Purée & Steinherr model.
Source: Central Bank of Kenya (2021).
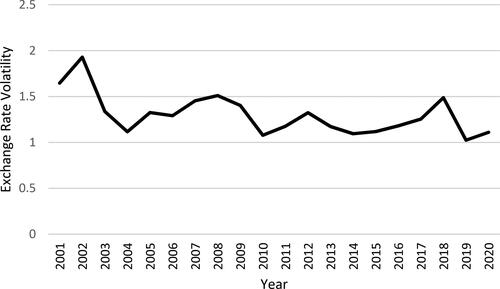
Table 1. Summary results of and coffee exported using gravity model.
Table 2. Summary results of and coffee exported with interaction term using gravity model.
Table 3. Summary results for robustness check using quantile regression.
Data availability statement
The data is available at the Mendeley data platform using either doi or URL below: Mendeley Data: doi: 10.17632/wkypp73j7z.1; Data URL: https://data.mendeley.com/datasets/wkypp73j7z/1.