
Figures & data
Figure 1. Illustration of decentralized versus centralized firms. Empirical investor networks delineate various network structures. Each node represents the identification code for an investor. Six investors are arbitrarily selected from distinct company-specific networks. For each connected investor pair in the network (i, j ≠ i), it represents that they traded the same stock in the same direction (buy or sell) a minimum of three times within a time window of Δt during a month. The decentralized and centralized network graphs are illustrated in the left and right figures, respectively.
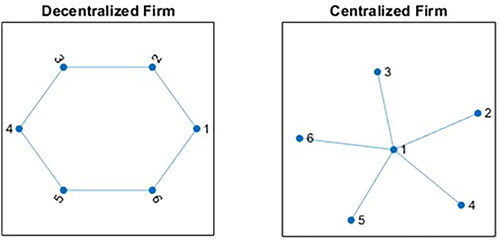
Table 1. Summary statistics.
Table 2. Returns for the simple momentum strategy.
Table 3. Returns for the turnover-based momentum strategies.
Table 4. Returns for the early-stage momentum strategies.
Figure 2. Compound returns for the momentum and centralization momentum strategies. Time-series patterns of compound monthly returns for the momentum (MOM; dotted line), directed-degree momentum (DD; solid line), and eigenvector momentum (EIG; dashed line) strategies. All stocks are ranked in ascending order at the end of each month based on their past-6-month cumulative returns. The stocks in the bottom one-third are assigned to the loser portfolio and those in the top one-third are assigned to the winner portfolio. The MOM represents a zero-investment portfolio that longs the winner portfolio and shorts the loser portfolio. The stocks in the winner and loser portfolios are further sorted into three subgroups based on their centralization index values: high, middle, and low centralization portfolios. DD represents a zero-investment portfolio that longs winners with low-directed-degree centralization and shorts losers with high-directed-degree centralization. EIG represents a zero-investment portfolio that longs winners with low eigenvector centralization, and shorts losers with high eigenvector centralization. The sample period is from January 2005 to December 2014.
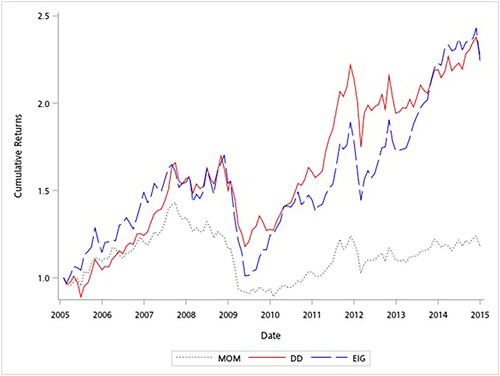
Table 5. Returns for the late-stage momentum strategies.
Table 6. Fama–MacBeth cross-sectional regressions with centralization index.
Table 7. Post-holding-period returns for the various momentum strategies.
Table 8. Returns for the simple momentum strategy in the interval of 2015–2023.
Table 9. Returns for the early-stage momentum strategies in split intervals of 2005–2009 and 2010–2014.
Table 10. Value-weighted returns for the various momentum strategies.
Table 11. Returns for an alternative momentum strategy.
Table 12. Limits to arbitrage and momentum returns.
Table 13. Sentiment variation and momentum returns.
Table 14. Market states and momentum returns.
Data availability statement
The data that support the findings of this study are available on request from the corresponding author, W.R. Liu, upon reasonable request. The data are not publicly available due to the presence of information that may compromise privacy.
