
Figures & data
Figure 1. Transition from open market negotiations to collaboration. Source: Spekman et al. (Citation1998).
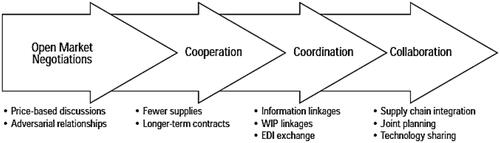
Table 1. Summary statistics of the variables in the study.
Figure 2. Conceptual framework.
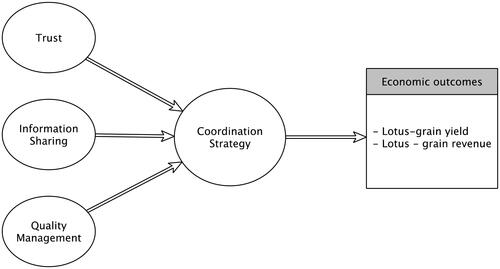
Table 2. Factors associated with the adoption of vertical coordination strategies: First-stage MESR estimation.
Figure 3. The adoption of different vertical coordination strategies by farming households. Source: Authors’ calculations.
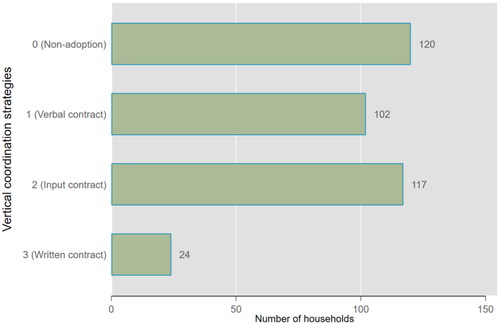
Figure 4. Unconditional lotus-grain yield density distribution.
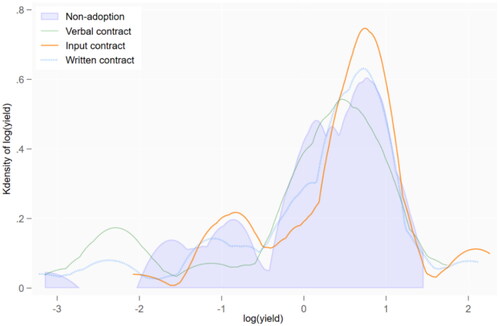
Figure 5. Unconditional lotus-grain revenue density distribution. Source: Authors’ calculations.
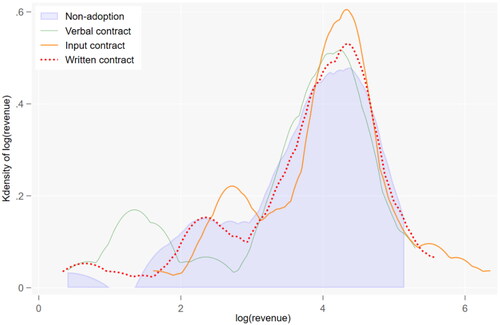
Table 3. Estimated results of the average treatment effects of vertical coordination strategies on lotus-grain household welfare in the MESR.
Figure A1. Lotus cultivation in Thua Thien Hue Province (2017–2020).
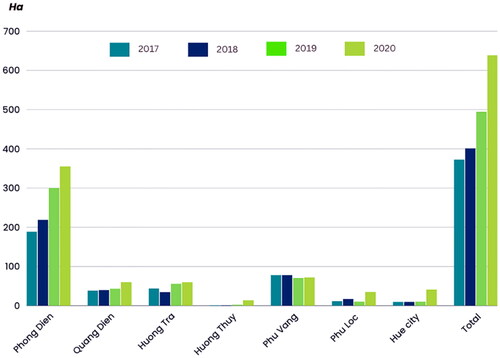
Figure A2. Lotus value chain in Central Vietnam (source: Authors’ calculations).
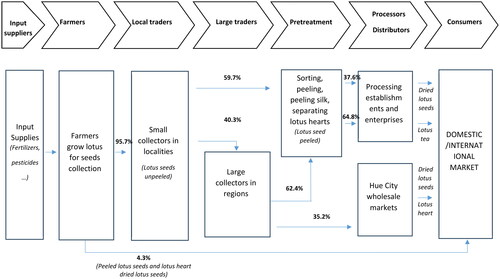
Table A1. The variances between the two polar extremes of the buyer–seller relationship continuum.
Table A2. Key characteristics distinguishing verbal, input, and written contracts in vertical coordination strategies in the lotus-grain value chain in the study areas from focus group discussions.
Table A3. Determinants of the adoption of vertical coordination strategies for lotus grain yield: Second-stage MESR estimation.
Table A4. Determinants of the adoption of vertical coordination strategies for lotus-grain revenue: Second-stage MESR estimation.
Table B1. Montiel-Pflueger robust weak instrument test.
Supplemental Material
Download PDF (182.3 KB)Data availability statement
Code to obtain results for the study is available upon reasonable request.
