
Figures & data
Figure 1. Electricity consumption (Billion kWh Per Year) in SSA from 2010 to 2021.
Source: Construct from U.S. Energy Information Administration (EIA, 2010–2021).
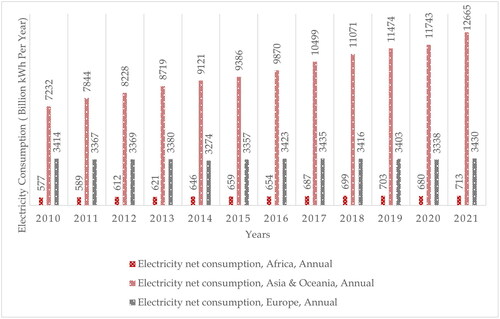
Figure 2. Electricity distribution loss (Billion kWh Per Year) in SSA from 2010 to 2021.
Source: Construct from U.S. Energy Information Administration (EIA, 2010–2021).
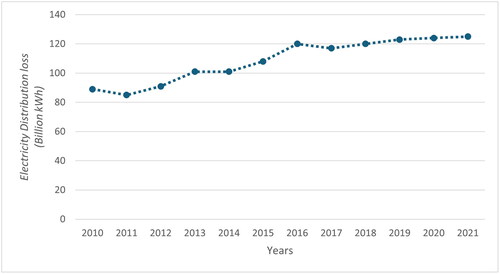
Table 1. Descriptive statistics.
Table 2. Matrix of correlations.
Table 3. Variance inflation factor.
Table 4. Panel cointegration test.
Table 5. Tax revenue and electricity consumption in forty-one countries in SSA.
Table 6. Tax revenue and electricity consumption fluctuations in forty-one countries in SSA.
Data availability
The author confirms that raw data and do-file used in deriving the findings of this study are available from the corresponding author (GJK) on request.