
Figures & data
Figure 1. Framework of FDI determination.
Source: Author’s estimation.
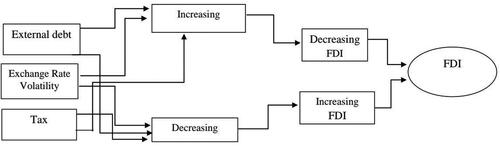
Figure 2. Representation of data.
Source: Authors estimation.
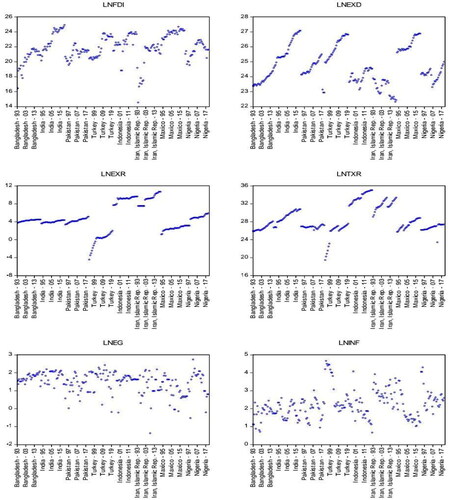
Table 1. Descriptive statistics.
Table 2. CIPS panel unit root test.
Table 3. Result of cross sectional dependency: Pesaran CD (PCD) test.
Table 4. Lag selection criteria.
Table 5. Result of cointegration test: Kao method.
Table 6. Robustness check by Johansen Fisher cointegration.
Table 7. Short-run estimations results of PMG Panel ARDL model.
Figure 3. Residual diagnostic: actual and fitted residual.
Source: Author’s estimation.
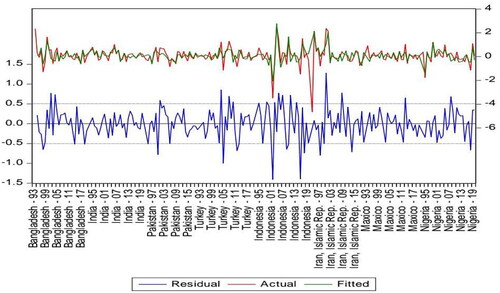
Table 8. Results of long-run estimations of PMG Panel ARDL model.
Table 9. Pairwise Dumitrescu Hurlin panel causality tests.
Data availability statement
Data will be made available based on requests.