
Figures & data
Table 1. Summary statistics of daily log-returns,
Table 2. Summary statistics of intraday returns,
Figure 1. Q-Q Plot of daily returns, and intraday returns,
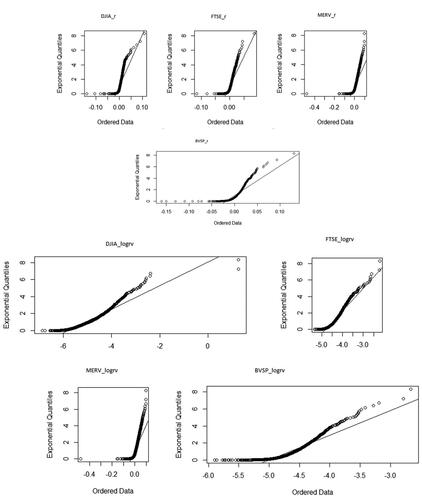
Table 3. The heteroskedasticity and serial correlation test during the non-crisis period.
Table 4. The heteroskedasticity and serial correlation test during the crisis period.
Table 5. The GPD parameter estimates during non-crisis period (2014–2019).
Table 6. The GPD parameter estimates during crisis period (2020–2022).
Table 7. The VaR violation ratios of the Conditional-EVT Model.
Table 8. The UC and CC test statistics of the Conditional-EVT Model during normal period.
Table 9. The UC and CC test statistics of the Conditional-EVT Model during crisis period.
Table 10. The RLF and FLF values.
Table 11. The backtesting procedure of expected shortfall.
Table 12. The best performance models based on the VaR forecast.