
Figures & data
Figure 1. Enrolment by type of higher education institutions UK, 1921–2019. Sources: Carpentier (Citation2004); DESa (Citation1961–1982); DESb (Citation1983); DESc (Citation1984–90); DESd (Citation1988–93); HESAb (Citation1995–current); Woodfield (Citation2014) for private providers.
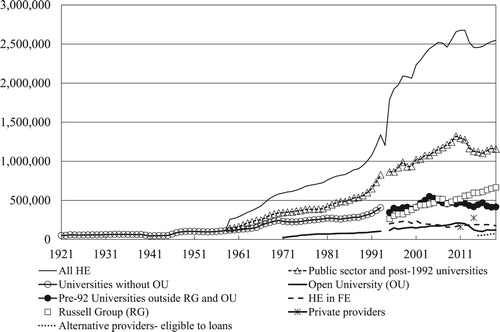
Figure 2. Share of enrolment by type of higher education institutions UK, 1959–2019. Sources: See .
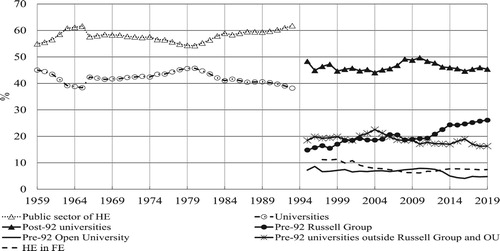
Figure 3. Income of higher education institutions (universities only before 1992) UK 1920–2019. Sources: Data for Universities (Carpentier Citation2004). Data for polytechnics before 1995 (Pratt Citation1997, 244–245). Data for HE after 1992 (HESAa Citation1995–current).
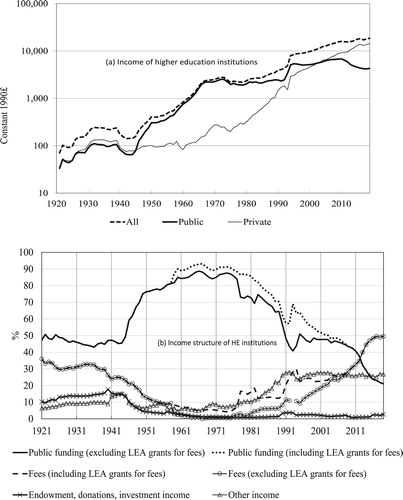
Figure 4. Resource (income) per Student at £1990 Prices, UK, 1921–2019. Sources: See for enrolment and for income.
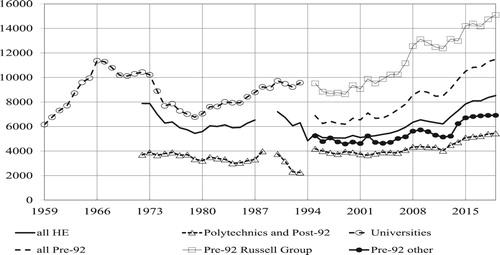
Figure 5. Income structure by type of institutions UK, 1921–2019. Sources: see .
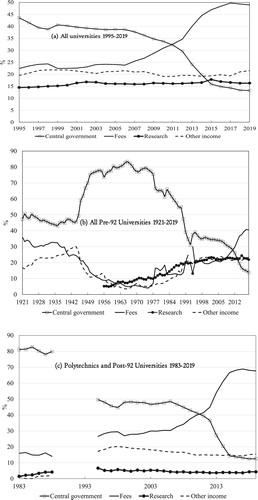
Figure 6. Total Full-time undergraduate entrants, UK, 1959–2018. Sources: HESAb (Citation1995–current).
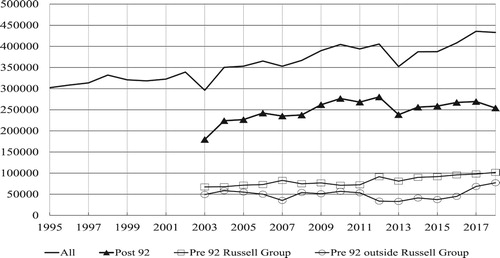
Figure 7. Number of students by mode of enrolment (Full-time/Part-time) 1959–2019 and UK population aged 18, Numbers and projections. 1959–2030. Sources: Carpentier (Citation2004); DESa (Citation1961–1982); DESb (Citation1983); DESc (Citation1984–90); DESd (Citation1988–93); HESAb (Citation1995–current); ONS (various years).
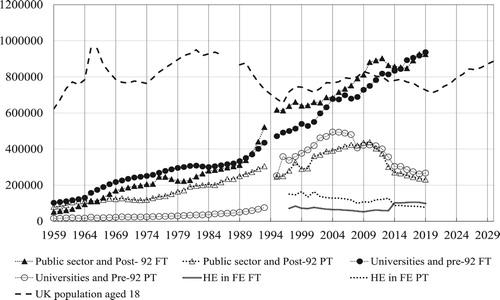
Figure 8. Proportion of part-time students per type of Institution- 1959–2019. Sources: see .
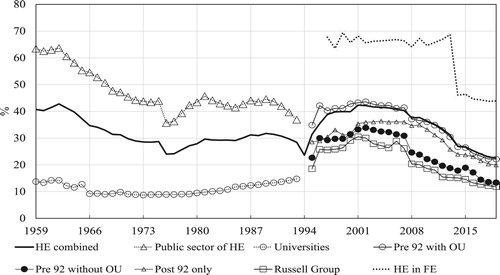
Figure 9. Distribution of enrolment in the non-university sector UK- 1959–1994. Sources: DESa (Citation1961–1982); DESb (Citation1983); DESc (Citation1984–90);DESd (Citation1988–93).
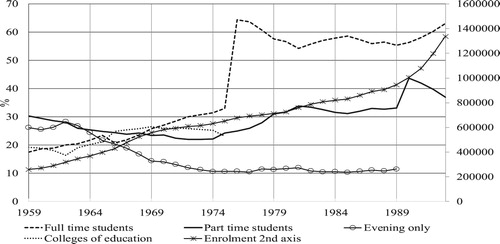
Figure 10. Number of postgraduate students per type of Institution- 1921–2019. Sources: Carpentier (Citation2004); DESa (Citation1961–1982); DESb (Citation1983); DESc (Citation1984–90); DESd (Citation1988–93); HESAb (Citation1995–current).
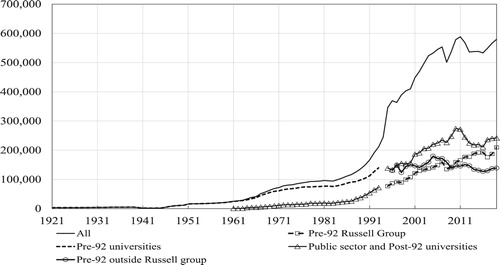
Figure 11. HE qualifications obtained by type of Institution. UK- 1921–2018. Sources: Carpentier (Citation2004); GCS (Citation1967–1998); HESAb (Citation1995–current).
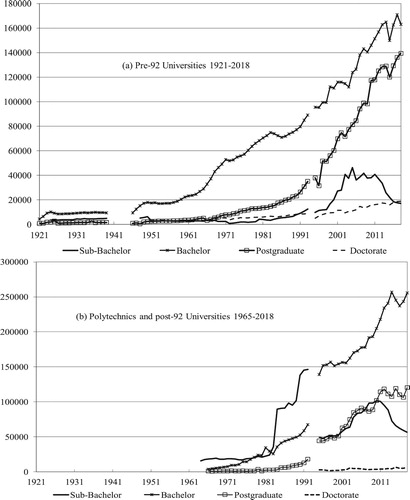
Figure 12. Enrolment (full-time UG and PG) distributed by subjects in the HE public sector (1966–1992) and the university sector (1966–2019). Sources: DESa (Citation1961–1982); DESb (Citation1983); DESc (Citation1984–90);DESd (Citation1988–93); UGCa (Citation1920–1965); UGCb (Citation1966–1979); UGCc (Citation1980–1988); UFC (Citation1989–1994); HESAb (Citation1995–current).
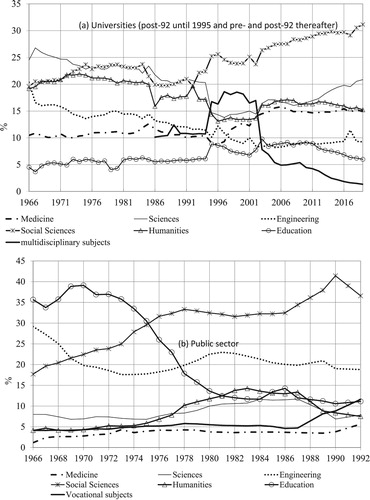
Figure 13. Proportion of international students in each type of institution, UK, 1921–2019 (Only Full-time until 1981). Sources: DESa (Citation1961–1982); DESb (Citation1983); DESc (Citation1984–90);DESd (Citation1988–93); UGCa (Citation1920–1965); UGCb (Citation1966–1979); UGCc (Citation1980–1988); UFC (Citation1989–1994); HESAb (Citation1995–current).
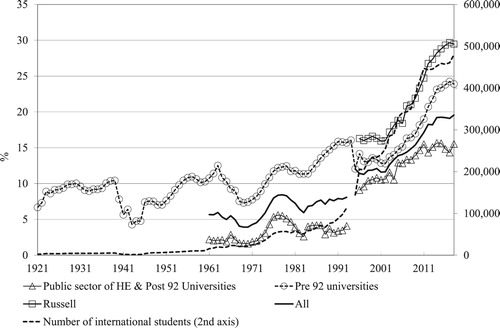
Figure 14. Gender Participation per type of Institutions 1959–2019. Sources: DESa (Citation1961–1982); DESb (Citation1983); DESc (Citation1984–90); DESd (Citation1988–93); UGCa (Citation1920–1965); UGCb (Citation1966–1979); UGCc (Citation1980–1988); UFC (Citation1989–1994); HESAb (Citation1995–current).
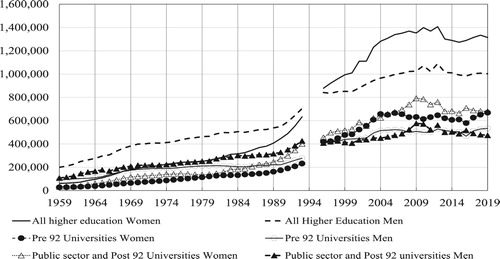
Figure 15. Gender participation per type of Institutions UK 1959–2019. Sources: DESa (Citation1961–1982); DESb (Citation1983); DESc (Citation1984–90); DESd (Citation1988–93); UGCa (Citation1920–1965); UGCb (Citation1966–1979); UGCc (Citation1980–1988); UFC (Citation1989–1994); HESAb (Citation1995–current).
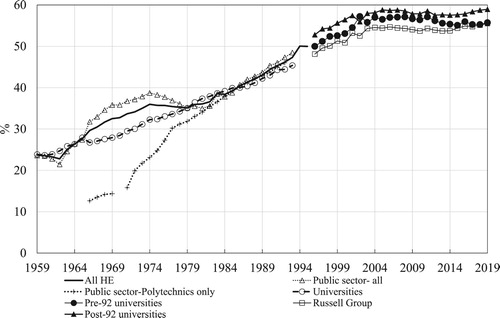
Figure 16. Proportions of women students in the public sector UK- 1959–1994. Sources: See Figure .
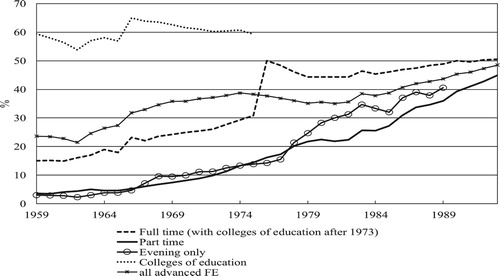
Table 1. Odds ratio Index of representation of social groups in education attainment.
Figure 17. Distribution of education attainment by socioeconomic categories by cohorts.
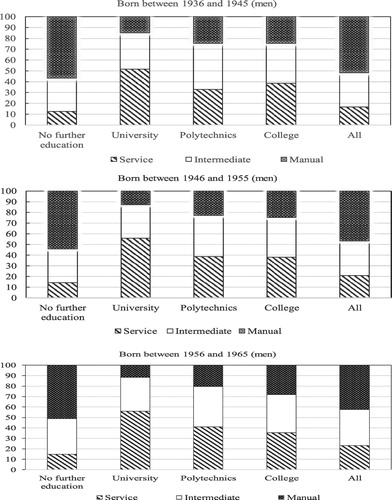
Figure 18. Percentages of Young full-time undergraduate entrants from National Statistics Socio-economic classes 4, 5, 6 and 7 by type of Institutions, 2003–2015. Sources: Pratt (Citation1997, 79); Ross (Citation2003, 72); HESAd (Citation2003–current).
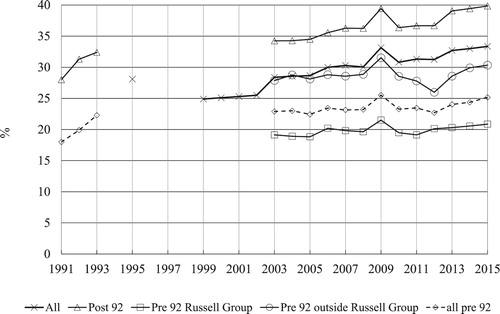
Figure 19. Percentages of young full-time first degree entrants from low participation neighbourhoods (POLAR) by type of Institutions, 2007–2019. Sources: HESAd (Citation2003–current).
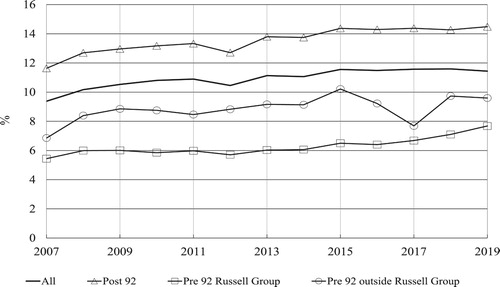
Figure 20. Percentages of young full-time first degree entrants from private schools, 2003–2019. Sources: HESAd (Citation2003–current).
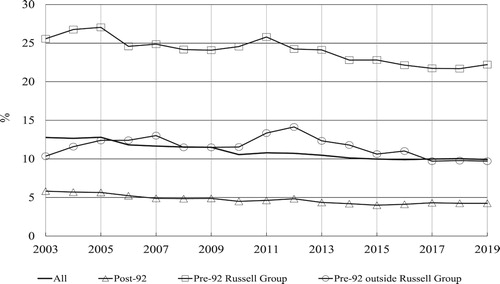
Figure 21. Percentages of the UK domiciled HE student enrolments (with known ethnicity) from minority ethnics (HESA classification) by type of Institutions, 2008–2019. Sources: HESAd (Citation2003–current).
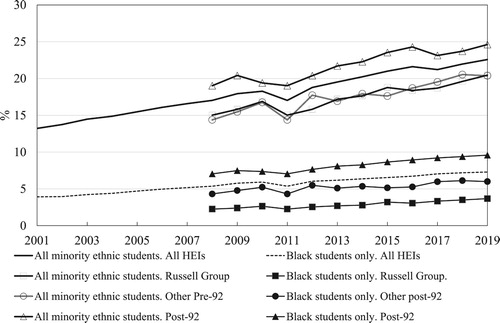
Table 2. A timeline of the expansion and differentiation of UK HE 1959–2020.