Figures & data
Table 1. Changes in the metabolic parameters under the influence of ATP, NE and their mixture in the initial conditions without cold load
Figure 1. Typical records of thermal and metabolic parameters at rapid cooling; darker areas show the first and second phases of the metabolic response to cooling.
Figure 2. Threshold decrease in skin (top) and rectal (bottom) temperature for cold defense responses in control (without any drugs) and on the background of ATP, NE, and their mixture. Significant differences from control – *P < 0.05, Student's t-test. Significant differences between NE and NE+ATP – # P < 0.05.
Figure 3. Effects of ATP, NE, and their mixture on the maximum values of cold defense responses. Black squares – the values of responses in control animals (without any drugs) are taken as 100%. Significant differences from control – * P < 0.05, Student's t-test.The absolute values of responses in controls are as follows: in the 1 phase of metabolic response O2 consumption −24.5±0.66 ml/min*kg, CO2 release −19.1±0.71 ml/min*kg; skin blood vessel constriction characterized by the decrease in skin temperature to 28.0±0.27°C; in the 2 phase of metabolic response O2 consumption −31.5±1.60 ml/min*kg, CO2 release −20.9±1.34 ml/min*kg; shivering (electrical muscle activity) −16.1±2.34.
Figure 4. Changes in the respiratory coefficient in the first and second phases of metabolic response to cooling in control (without any drugs) and on the background of ATP, NE, and their mixture. Significant differences from control – * P < 0.05, Student's t-test. The absolute values of the respiratory coefficient (RC) changes in control animals: in the 1 phase of metabolic response RC increases by 0.09±0.008 (P < 0.05); in the 2 phase of metabolic response RC decreases by 0.08±0.007 (P < 0.05).
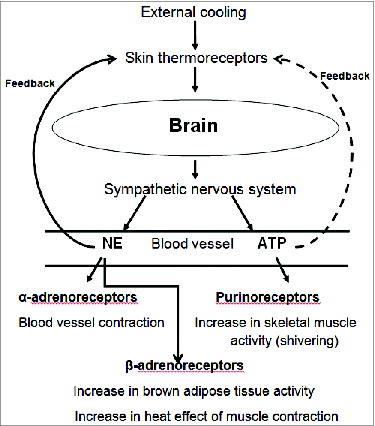
Figure 5. Scheme of ATP and NE participation in regulation of thermoregulatory responses. The presented data may testify in favor of the influence of ATP on the skin thermoreceptors, however, to be sure, the data on the effect of ATP on impulse activity thermoreceptors need. That is why the feedback effect of ATP on thermoreceptors is shown by dotted line.