
Figures & data
Figure 1. Body mass of control mice (Group-1, left panel) and obese mice (Group-2, right panel) before, during fasting (f1-3 or f1-5) and after (rf1-5) fasting lasting for 3 d or 5 weeks, respectively(f – days or weeks of fasting, rf – days or weeks of refeeding). Mean ± SEM are shown.
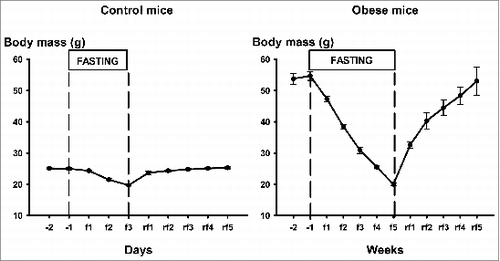
Figure 2. Daily body core temperature (Tc) of control mice (Group-1, left panel) and obese mice (Group-2, right panel) before, during and after fasting lasting for 3 days or for 26 days, respectively. Single mouse experiments (one-hour averages) are shown.
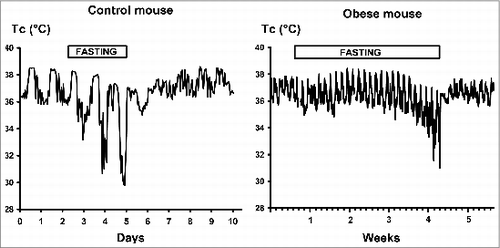
Figure 3. Upper panel: Night-time maximal (Tc max), daytime minimal (Tc min) and daily average core temperature (Tc mean) in obese mice (Group-2) before fasting, during the first days (2, 5, 10) of fasting, during the last week of fasting (7 and 1 day before re-feeding) and on 1st and 5th days of re-feeding. Lower panel: Daily excursions of core temperature were determined from differences between night maxima and day minima using one-hour averages of core temperature. Asterisks show significant differences between the data sets indicated (**P < 0.01, ***P < 0.001, one-way ANOVA). All mice were fed on a fat-rich diet before and after fasting. Mean ± SEM are shown.
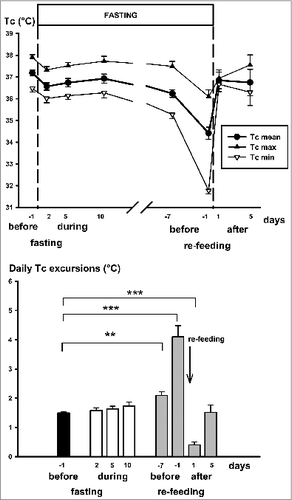
Figure 4. Daytime minimum core temperature (2-hour averages) (Tc min) as a function of body mass in obese (Group-2, filled symbols) and control (Group-1) mice (open symbols) during fasting. Measurements on the same animals were performed on different fasting days. Regression lines for control group (thin) and obese animals (thick) are indicated. For details of statistics see Results.
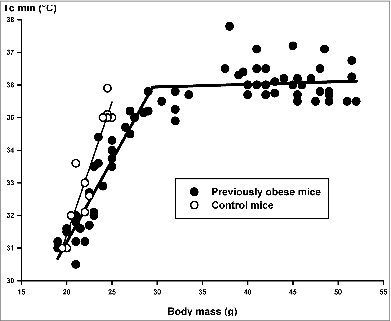
Figure 5. Locomotor activity in a lean mouse (left panel) and in an obese mouse (right panel). See progressive rises of activity during fasting and rapid decrease on re-feeding both in the obese mouse and in the control mouse. AU = arbitrary units. Two-hour averages are shown. For details of statistics see Results.
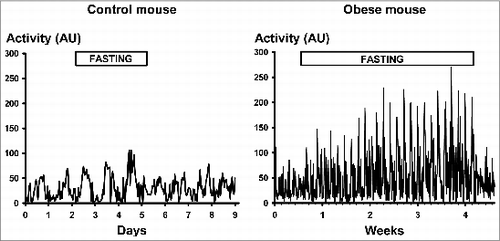
Table 1. Values of spontaneous night-time locomotor activity (12-h averages) in obese mice (Group-2) during the first days (2, 5, 10) of fasting, 7 days before re-feeding and on the first day after re-feeding (values are shown as percentage of the last pre-fasting control day values). For details of statistics see Results