2,287
Views
12
CrossRef citations to date
0
Altmetric
Priority Report

β-amyloid infusion into lateral ventricle alters behavioral thermoregulation and attenuates acquired heat tolerance in rats

, , , , &
Pages 418-424 | Received 16 Feb 2015, Accepted 20 Apr 2015, Published online: 13 Oct 2015

Figures & data

Figure 1. The mean Tab in CN and Aβ–infused rats. (A) Before surgery, Tab levels of CN (black circle) did not differ from those of Aβ-infused rats (red circle). (B) Twelve days after surgery, Tab of the light phase in Aβ-infused rats was significantly higher than that of CN. Dark bars above abscissa indicate the dark phase of the day. Values are the means ±S.E.Ms (n = 6 in each group).
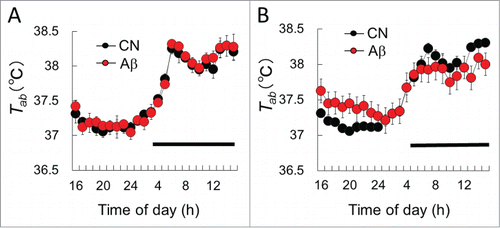
Figure 1. The mean Tab in CN and Aβ–infused rats. (A) Before surgery, Tab levels of CN (black circle) did not differ from those of Aβ-infused rats (red circle). (B) Twelve days after surgery, Tab of the light phase in Aβ-infused rats was significantly higher than that of CN. Dark bars above abscissa indicate the dark phase of the day. Values are the means ±S.E.Ms (n = 6 in each group).

Figure 2. The mean Ts in CN and Aβ–infused rats. (A) Ts value of day in CN (black circle) and Aβ-infused rats (red circle). Dark bar above abscissa indicates the dark phase of the day. (B) Mean Ts of CN (black bar) and Aβ-infused rats (red bar) in the light and dark phase. In the light phase, mean Ts of Aβ-infused rats was significantly lower than that of CN. However, in the dark phase, mean Ts of Aβ-infused rats was significantly higher than that of CN. Values are the means±S.E.Ms (n = 6 in each group). *Shows significant difference of the light phase and dark phase. # shows significant difference between CN and Aβ-infused rats.
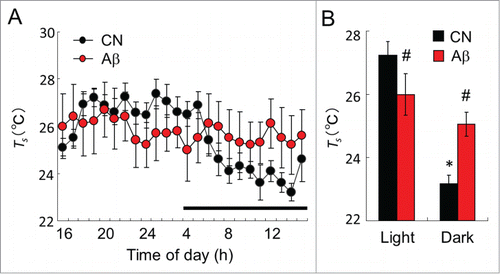
Figure 2. The mean Ts in CN and Aβ–infused rats. (A) Ts value of day in CN (black circle) and Aβ-infused rats (red circle). Dark bar above abscissa indicates the dark phase of the day. (B) Mean Ts of CN (black bar) and Aβ-infused rats (red bar) in the light and dark phase. In the light phase, mean Ts of Aβ-infused rats was significantly lower than that of CN. However, in the dark phase, mean Ts of Aβ-infused rats was significantly higher than that of CN. Values are the means±S.E.Ms (n = 6 in each group). *Shows significant difference of the light phase and dark phase. # shows significant difference between CN and Aβ-infused rats.

Figure 3. Heat tolerance test in CN and Aβ–infused rats. (A) Ta of the chamber in the heat tolerance test. Ta was gradually raised from time at 0 min. (B) Tab responses to gradient heat of CN (black circle) and Aβ-infused rats (red circle). The Tab values of all rats were monitored by a telemetry system. Tab responses of CN and Aβ-infused rats did not significantly change. (C) c-Fos+ cells in the PO/AH. Green signals show c-Fos+ cells. The expression level of c-Fos+ cells of CN (left) and Aβ-infused rats (right) did not alter. Scale bar: 50 μm. (D) Over view of PO/AH of hypothalamic section. Red box shows immuno-stained area of (C). ac, anterior comm. ox, optic chiasm.
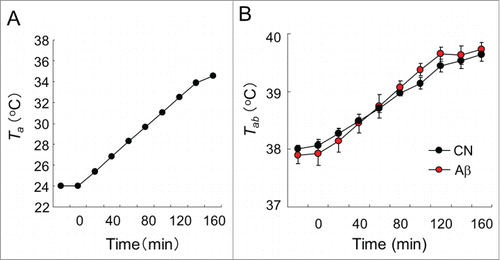
Figure 3. Heat tolerance test in CN and Aβ–infused rats. (A) Ta of the chamber in the heat tolerance test. Ta was gradually raised from time at 0 min. (B) Tab responses to gradient heat of CN (black circle) and Aβ-infused rats (red circle). The Tab values of all rats were monitored by a telemetry system. Tab responses of CN and Aβ-infused rats did not significantly change. (C) c-Fos+ cells in the PO/AH. Green signals show c-Fos+ cells. The expression level of c-Fos+ cells of CN (left) and Aβ-infused rats (right) did not alter. Scale bar: 50 μm. (D) Over view of PO/AH of hypothalamic section. Red box shows immuno-stained area of (C). ac, anterior comm. ox, optic chiasm.

Figure 4. Ability of acquired heat tolerance in CN and Aβ-infused rats. (A) Heat tolerance test in CN (black circle) and Aβ–infused rats (red circle) after long term heat exposure. The increase in the Tab values was slower for CN rats than that for the Aβ-infused rats. #, significant difference between CN and Aβ-infused rats. Values are the mean ±SEM (n = 4). (B) PCNA and (C) Dcx immunostaining in the hypothalamus. Scale bar, 100 µm. (D) Western blot analysis of Dcx protein in the hypothalamus. (Left) Western blot analyses were performed using anti-Dcx antibody. Blots were then stripped and reprobed with anti-GAPDH antibody to verify that equal amount of protein was electrophoresed in each lane. (Right) The densitometric data on Dcx/GAPDH of CN (black bar) and Aβ-infused rats (red bar). # shows significant difference between CN and Aβ-infused rats. Values are the mean ±SEM (n = 4).
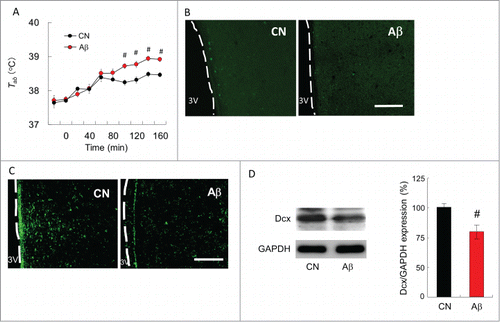
Figure 4. Ability of acquired heat tolerance in CN and Aβ-infused rats. (A) Heat tolerance test in CN (black circle) and Aβ–infused rats (red circle) after long term heat exposure. The increase in the Tab values was slower for CN rats than that for the Aβ-infused rats. #, significant difference between CN and Aβ-infused rats. Values are the mean ±SEM (n = 4). (B) PCNA and (C) Dcx immunostaining in the hypothalamus. Scale bar, 100 µm. (D) Western blot analysis of Dcx protein in the hypothalamus. (Left) Western blot analyses were performed using anti-Dcx antibody. Blots were then stripped and reprobed with anti-GAPDH antibody to verify that equal amount of protein was electrophoresed in each lane. (Right) The densitometric data on Dcx/GAPDH of CN (black bar) and Aβ-infused rats (red bar). # shows significant difference between CN and Aβ-infused rats. Values are the mean ±SEM (n = 4).