Figures & data
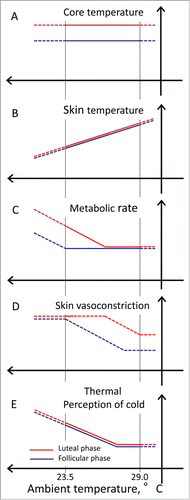
Figure 1. Difference in thermoregulation during a cold exposure between the luteal and follicular phases. Based on the study by Matsuda-Nakamura et al. (solid lines) and my speculation (dotted lines), thermoregulatory responses to cold in the luteal and follicular phases are illustrated. Core temperature (A), metabolic rate (B), mean skin temperature (C), skin vasoconstriction activity (D), and the strength of thermal perception during a cold exposure are shown. Red and blue lines denote the luteal and follicular phases, respectively.