Figures & data
Table 1. Average height and weight for two age categories in the Dutch population.Citation12
Figure 1. (A) Aerial view of Hermitage Amsterdam museum. (B) One of two main exhibition rooms with a large glass roof. (C) The entrance stairway from the lobby to the main exhibition room with an air curtain to reduce air exchange. (D) A cross section of one side of the building showing the main exhibition room and adjacent cabinets. Figure source: Ref. Citation14.
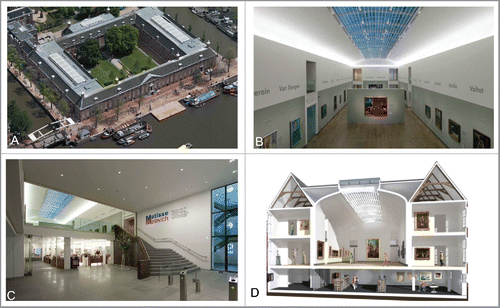
Figure 2. The used survey including numerical transcription used for statistical analysis.
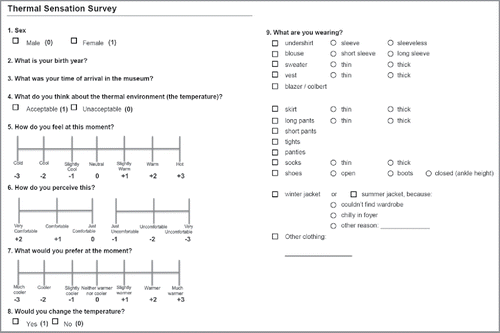
Table 2. Specification of instruments used for indoor climate measurements.
Figure 3. Number of males and females per age group.
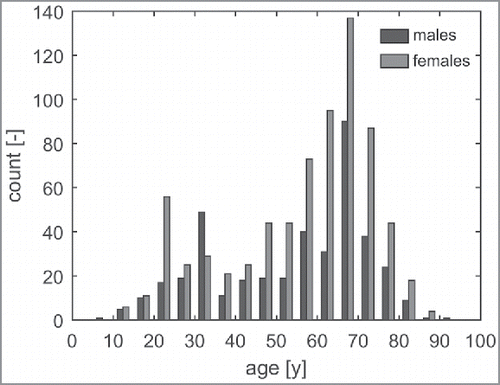
Table 3. Number of respondents of the subpopulations used for further analysis.
Table 4. Input variables of the PMV model and methods of determination.
Figure 4. Mean operative temperatures ± SD during the survey days as a function of the running mean outdoor temperature (RMOT) according to Equation (Equation3(3)
(3) ).
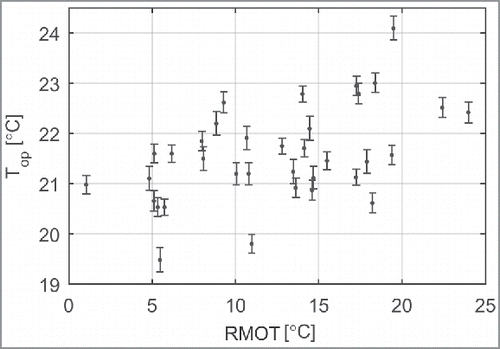
Figure 5. AMV versus PMV using an assumed metabolic rate of 1.5 Met and the line of identity (dashed).
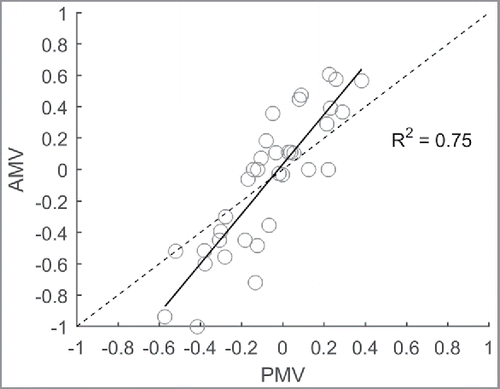
Figure 6. (A) All identified metabolic rates. (B) Identified metabolic rates of adults and elderly. The age groups 30–40 y and 65–75 y were chosen because information on these groups was available from the database of the Dutch central bureau for statistics (CBS) shown in .
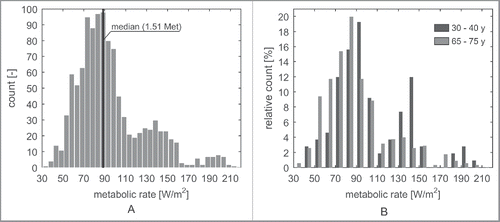
Figure 7. Calibrated metabolic rates of males and females for different age categories. The age groups 30–40 y and 65–75 y were chosen because information on these groups was available from the database of the Dutch central bureau for statistics (CBS) shown in .
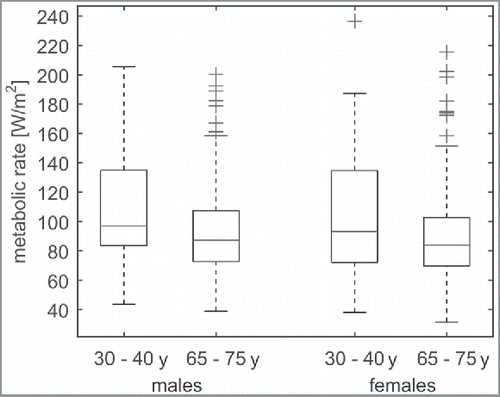
Table 5. Relevant correlations between prediction residuals and the variables RMOT (running mean outdoor temperature), Clo (clothing insulation), and RHi (indoor air relative humidity).
Figure 8. AMV versus PMV* and the line of identity (dashed).
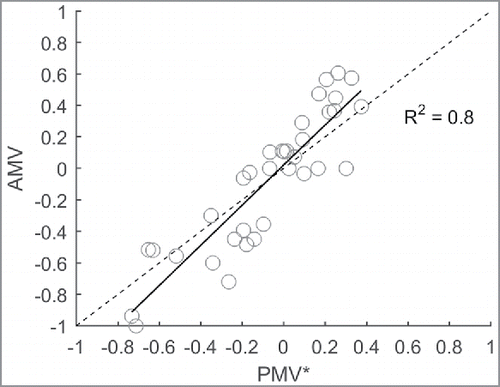
Table 6. Correlations between prediction residuals and the variables RMOT (running mean outdoor temperature), Clo (clothing insulation), RHi (indoor air relative humidity).
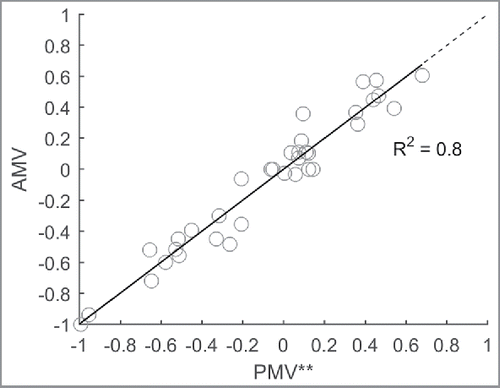
Figure 9. AMV compared with PMV**. Regression analysis shows the relation is very close to the line of identity (dashed): AMV = 0.997 PMV**-0.0002.