Figures & data
Figure 1. Simplified schematic representation of cold-induced thermogenesis. Afferent input represented by green boxes, efferent output represented by red box, thermoregulatory control center (hypothalamus) and integrated response (core temperature) represented by black boxes. Model adapted from refs. Citation9,Citation10,Citation12.
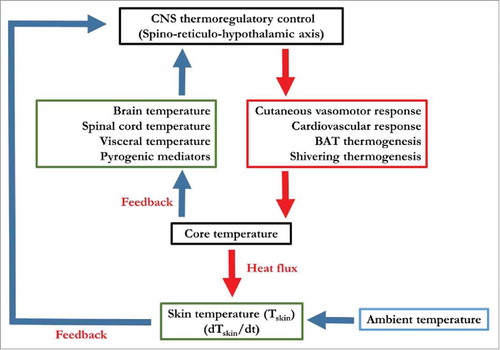
Figure 2. Changes in shivering intensity as a function of changes in mean skin temperature measured under compensable conditions (no change in Tcore). Data adapted from refs. Citation20–Citation22, Citation42, Citation43, Citation52, Citation56, Citation68.
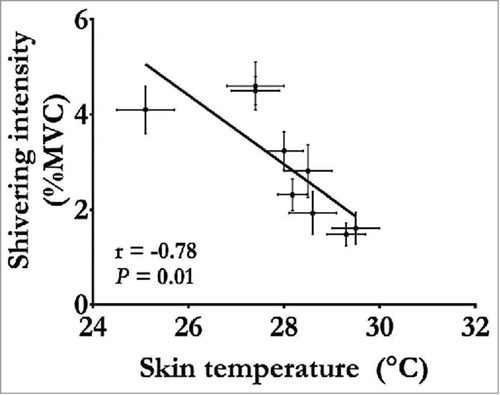
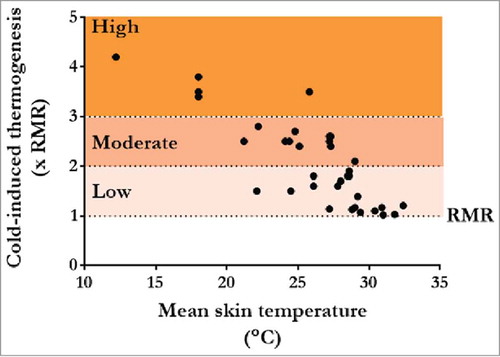
Figure 3. Changes in thermogenic rate (times resting metabolic rate (xRMR)) as a function of changes in average skin temperature found in various cold exposure studies in lean healthy men. Thermogenic rates are characterized as mild (1–2 xRMR), moderate (2–3 xRMR) and high (>3 xRMR). Points represent data from end of cold exposure for following studies.Citation19–Citation22,Citation24,Citation34,Citation36,Citation39–Citation64