Figures & data
Table 1. Physical characteristics (mean ± sd) of the studied grape-picking workers.
Table 2. Percentage of work shift time spent in each category of environmental factors, heat stress indices, and ΔT sk.
Figure 1. Hourly percentage (mean ± sd) of work time spent on irregular work breaks (WTB) during each hour (local Cyprus time) of the recorded work shifts. Blue bars show results from all the studied work shifts. Red and green bars show results from all the summer and autumn work shifts, respectively. Asterisks indicate significant (p < 0.05) differences from the work hour to the left. The lunch break (which is not included in the WTB) was always taken at 11:00 and lasted for 30 min.
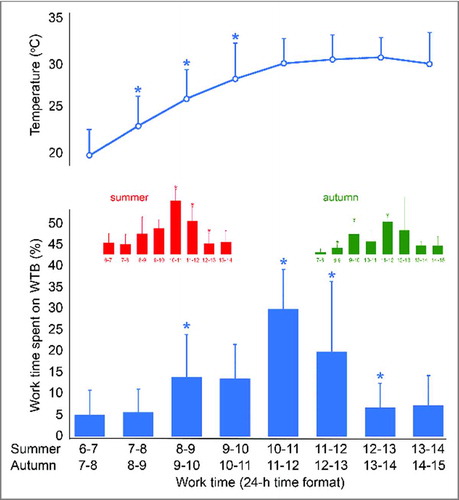
Figure 2. Mean duration of uninterrupted labor (dotted lines corresponding to the left vertical axis) and mean work time spent on irregular breaks (WTB; bars corresponding to the right vertical axis) based on the UTCI (blue color) and WBGT (green color) categories. Asterisks indicate significant (p <0.05) differences from the UTCI or WBGT category to the left. The reference values for UTCI are as follows: 9–26°C: no thermal stress; 26–32°C: moderate heat stress; 32–38°C: strong heat stress; 38–46°C: very strong heat stress; > 46°C: extreme heat stress. The reference values for WBGT are as follows: ≤ 25.6–27.7°C: no heat stress; 27.8–29.4°C: low heat stress; 29.4–31.0°C: moderate heat stress; 31.0–32.1°C: high heat stress; ≥ 32.2°C: extreme heat stress.
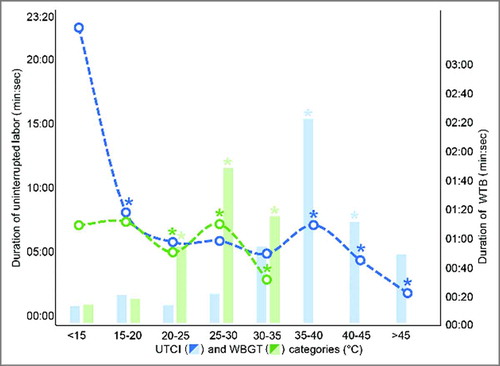
Figure 3. Mean duration of uninterrupted labor (dotted lines corresponding to the left vertical axis) and mean work time spent on irregular breaks (WTB; bars corresponding to the right vertical axis) based on the ΔT sk (beige color) and the solar radiation (red color) categories. Asterisks indicate significant (p < 0.05) differences from the ΔT sk or solar radiation category to the left. Note: ΔT sk = difference between the baseline mean skin temperature and the current mean skin temperature.
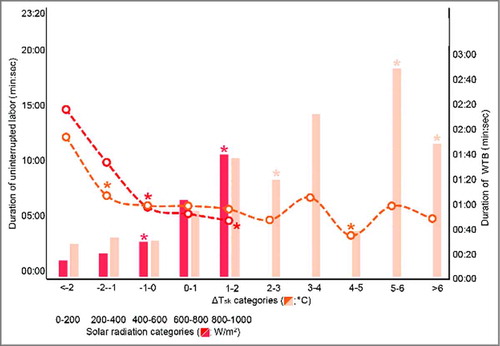
Figure 4. Loss of labor for each category of environmental factors, heat stress indices, and ΔT sk. Each full gray body figure represents one work shift lost per ten work shifts due to work time spent on irregular breaks (WTB). Note: T air = air temperature; WBGT = wet bulb globe temperature; UTCI = universal thermal climate index; sol R = solar radiation; ΔT sk = difference between the baseline mean skin temperature and the current mean skin temperature.
Figure 5. Fluctuation in mean skin temperature (mean ± sd) of the studied workers across the 8-h work shifts (local Cyprus time) during the summer (left pane) and the autumn (right pane) study periods. The background images illustrate the same worker picking grapes during the summer (left) and the autumn (right). Seasonal comparisons demonstrated significant differences (p < 0.05) during the majority of the work shift time.
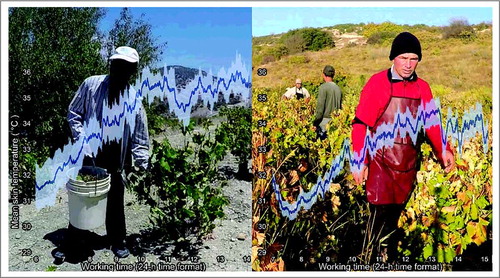
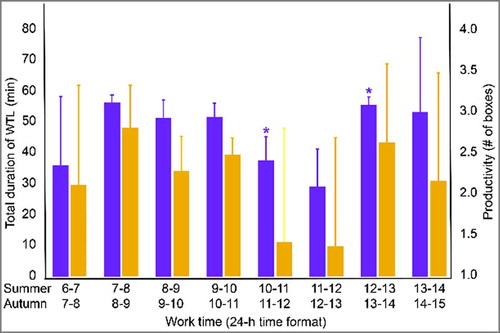
Figure 6. Fluctuation (mean ± sd) in the true work time spent on labor (WTL) during the previous hour (left vertical axis; purple bars) and the hourly productivity (right vertical axis; orange bars) of the studied workers across the 8-h work shift (local Cyprus time). Asterisks indicate significant differences (p < 0.05) from work hour to the left.