Figures & data
Figure 1. Muscle twitch at resting basal (plain line, blue) and elevated (dashed line, red) muscle temperature. An increase in muscle temperature generally increases the rate of force development and relaxation without modifying the peak tension. Data extracted with permission from Racinais et al.Citation45
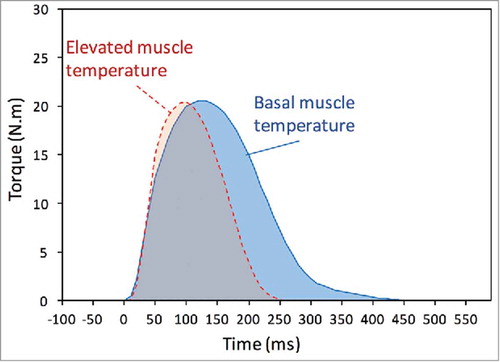
Figure 2. Hyperthermia reduces the ability to sustain force/torque production (upper panel) and neural drive to the muscle (lower panel) during a 120-s maximal voluntary contraction. Data represent mean and 95% confidence-intervals from 14 participants in control or hyperthermic (rectal temperature 39°C) state. Reproduced with permission from Racinais et al.Citation111
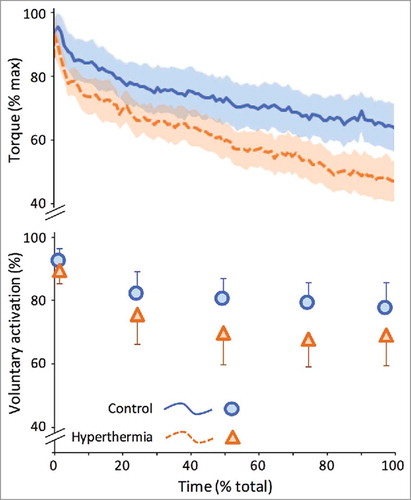
Figure 3. Heat acclimation increases peak twitch amplitude in both normothermic (COOL) and hyperthermic (HOT) state (left panel). Heat acclimation also improves the torque/EMG relationship (right panel). Reproduced with permission from Racinais et al.Citation45
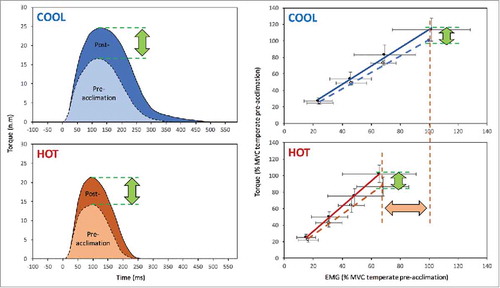
Figure 4. Power output and cardiovascular response during a 40-km cycling time trial in Hot (35°C) and Cool (20°C) conditions. Values are means ± SD for 8 subjects. ∗Significantly different from Cool (P < 0.05). §Significantly higher than previous (P<0.01). †Significantly lower than 10 min (P < 0.05). Reproduced with permission from Périard et al.Citation17
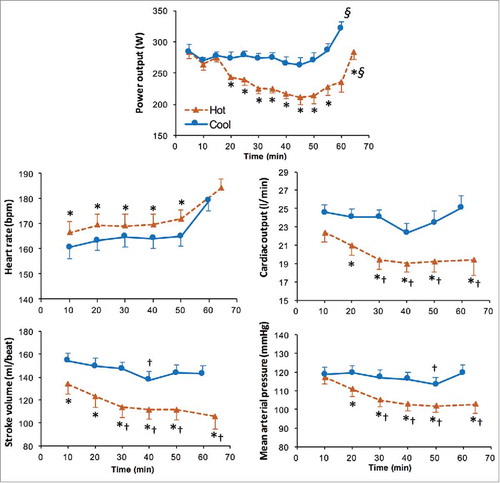
Figure 5. Middle cerebral artery mean blood velocity (MCA Vmean) during a self-paced time trial (750 kJ) in HOT and COOL conditions. Values are means ± SEM. *Significant difference between HOT and COOL (P < 0.05). §Significantly higher than all other values (P < 0.05). Reproduced with permission from Périard and Racinais.Citation184
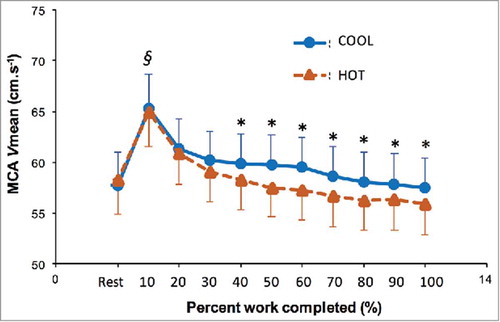
Figure 6. Warming-up for short-, intermediate- and long-duration events and the impact of environmental heat stress on the duration of ‘RAMP’ based warm-up protocols. Physiological underpinning of the “Raise,” “Activate and Mobilize,” and “Potentiate” stages are highlighted for each sporting duration, in addition to demonstration of the potential impact of post-warm up passive heating strategies.
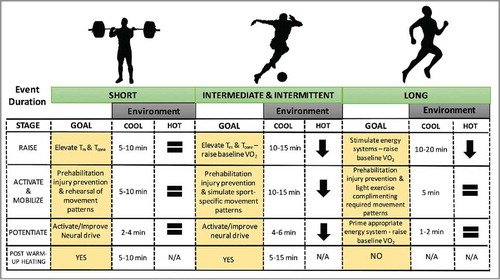
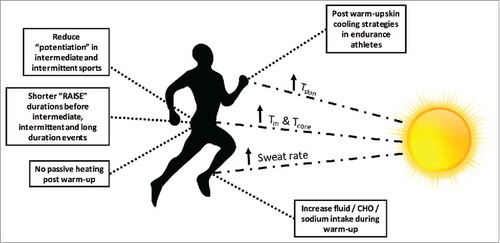
Figure 7. Altering a warm-up to accommodate for hot ambient conditions. Some applied protocol recommendations for altering the RAMP protocol; the use of post warm-up passive heating/cooling strategies and altering nutritional intake to reduce the impact of heat stress on subsequent performance. CHO = carbohydrate.