Figures & data
Figure 1. Photographs of the Delrin plastic housing and cap unassembled (A) and assembled (B) with a Star-Oddi DST nano-T probe. A clear window in at the end of the probe allowed the temperature sensor to be oriented toward the ventral surface of the tail. The housing was glued on each side of the tail at a consistent distance from the base (C & D). E, A representative graph from an individual OVX mouse shows wide fluctuations in TSKIN. The dark phase is indicated by black bars. Scale bar in A = 10 mm, applies to A.
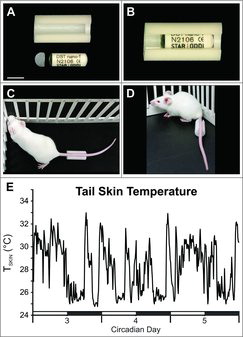
Figure 2. Protocols of Exp. 1–3 (A) and Exp. 4 (B). A, Mice were ovariectomized (OVX) and one week later received s.c. capsules containing 180 µg/mL E2 or vehicle. Circadian rhythms of TCORE, TSKIN and activity were recorded over a 5 day period with mice in their home cages. From days 13–21, the mice were exposed to various TAMBIENT in an environmental chamber. The next day, mice were injected s.c. with either senktide or vehicle. Mice received a second injection two days later in a crossover design. B, Protocol of Exp. 4. Ten mice were OVX and 15 days later implanted with s.c. capsules containing 360 µg/mL E2. The capsules were removed after 7 days and after a wash out period, the mice were implanted with capsules containing 720 µg/mL E2. Circadian rhythms of TCORE, TSKIN and activity were recorded for 3 day intervals in the animals home cages (grey bars). Black arrowheads, OVX; grey arrowheads, capsule implants; open arrowheads, blood sample collection. E2, 17β-estradiol; OVX, ovariectomized; VEH, vehicle.
Figure 3. E2 treatment of OVX mice reduces TCORE during the light phase (A, B) with no significant effect on TSKIN (C, D), heat loss index (E, F) or activity (G, H). The line graphs (left) show the mean values for each group 3 to 5 days after E2 treatment. The lines are generated with a moving average of 5 points and the black bars on the X axis denote the dark phase. The bar graphs (right) show data analysis (mean ± SEM) from days 3–5. Light vs dark phase differences were identified (B, D, F, H), except for TSKIN in the OVX + E2 group (D). Unlike previous studies in the rat, E2 did not decrease TSKIN or HLI in the dark phase. n = 9 – 10 mice/group, + Significantly different OVX vs OVX + E2, p = 0.02, * Significantly different light vs dark within treatment group, p < 0.01, ** Significantly different light vs dark within treatment group, p < 0.001.
Table 1. Treatment of OVX mice with higher concentrations of E2 reduces TCORE during the light phase, with no effect on TSKIN, HLI or activity.
Figure 4. Effects of E2 treatment on TCORE (A), TSKIN (B), HLI (C) and HLI variability (D) in OVX mice exposed to TAMBIENT ranging from 20–36°C. A, TCORE was lower in E2 treated mice at a wide range of TAMBIENT. At 35 and 36°C the TCORE was significantly elevated in both groups. B and C, At select TAMBIENT, both TSKIN and HLI were significantly lower in OVX + E2 mice. D, At the high TAMBIENT of 34–36°C, HLI variability is reduced, reflecting constant vasodilation to dissipate body heat. n = 9 – 10 mice/group. * Significantly different OVX vs OVX+E2, p < 0.05, + Significantly different than the majority of values at the other TAMBIENT, p < 0.05.
Figure 5. Average TCORE (A), TSKIN (B), heat loss index (C) and activity (D) during the estrous cycle of the mouse. Circadian rhythms were observed but there was no effect of the phase of the estrous cycle. Values represent mean ± SEM, n = 16 cycles averaged from 6 mice. + Significantly different than light phase p < 0.05, * Significantly different than light phase p < 0.01.
Figure 6. Effects of s.c. injections of the NK3 receptor agonist senktide (or vehicle) on TCORE (top) and TSKIN (bottom) in OVX (left) and OVX + E2 (right) treated mice. Senktide acutely lowered TCORE (A) and increased TSKIN (C) in OVX mice. In OVX + E2 treated mice, the TCORE reduction after senktide was blunted (B) and the acute rise in TSKIN did not occur (D). Values represent mean ± SEM, 0 = time of injection, A and B, n = 9 – 10 mice/group; C, n = 5 mice; D, n = 7 mice, * Significantly different from vehicle, p < 0.01 (TCORE) or 0.05 (TSKIN).