
Figures & data
Table 1. Physiological data (mean ± SD) on days 1 and 6 of heat acclimation (HA).
Table 2. Physiological data (mean ± SD) during pre and post heat acclimation (HA) sweat mapping experimentation. Surface area weighted gross sweat loss (SA weighted GSL) was calculated from regional sweat rates for the surface area covered by pads only.
Figure 1. Absolute gross sweat loss (GSL; g ⋅ h−1) and metabolic rate (W kg−1) at exercise intensity 1 (I1) and intensity 2 (I2) during pre- and post- heat acclimation (HA) sweat mapping experiments. * indicates p < 0.05.
Table 3. Significance level of pre- versus post- heat acclimation regional sweating rates. Gray shading indicates a significant decrease whilst no shading indicates a significant increase.
Figure 2. Absolute pre- and post-acclimation regional median sweat rates of the torso and arms in male athletes at exercise intensity 1 and 2. Image created by Gavin Williams.
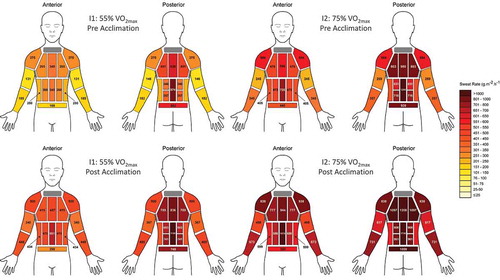
Figure 3. Normalized pre-and post-acclimation regional median sweat rates of the torso and arms in male athletes at exercise intensity 1 and 2. Image created by Gavin Williams.
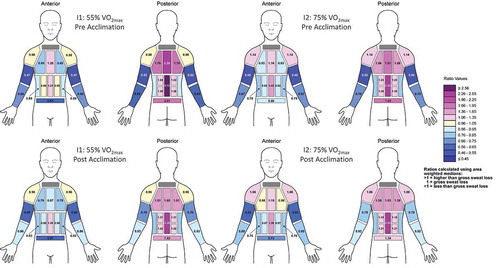
Figure 4. Individual normalized pre- and post- heat acclimation sweating rates for central (torso) versus peripheral (arms) regions at intensity 1 (I1) and intensity 2 (I2). * indicates p < 0.05.
Table 4. Pre and post heat acclimation (HA) regional skin temperature during sweat mapping experiments at 5 measurement periods: baseline (BL), pre I1 pad application (Pre I1), post I1 pad application (Post I1), pre I2 pad application (Pre I2), and post I2 pad application (Post I2). Significant changes within regions from the previous measurement period are indicated by the symbols listed below the table. A significant decrease is indicated by grey shading (![]() ).
).