Figures & data
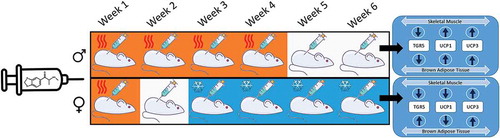
Figure 1. (a) Weekly comparison of ∆°C from baseline temperature in male treatment group at 30 (●), 60 (■), and 90-min (▲) post treatment vs male saline controls at 30 (○), 60 (□), and 90-min (△) time points. Significance of hyperthermic response is denoted by asterisks; * = p < 0.05, ** = p < 0.01, *** = p < 0.001, while significant tolerance effects are denoted by †. (b) Weekly comparison of ∆°C from baseline temperature in female treatment group at 30 (●), 60 (■), and 90-min (▲) post treatment vs female saline controls at 30 (○), 60 (□), and 90-min (△) time points. Significance of hyperthermic response is denoted by asterisks; * = p < 0.05, ** = p < 0.01, *** = p < 0.001, while significant tolerance effects are denoted by †. Significant hypothermic effect is denoted by cent sign. (c) Weekly comparison of ∆°C from baseline temperature in male treatment group at 30 (●), 60 (■), and 90-min (▲) post treatment vs female treatment group at 30 (○), 60 (□), and 90-min (△) time points. Significance of hyperthermic response is denoted by asterisks; * = p < 0.05, ** = p < 0.01 =, *** = p < 0.001.
Figure 2. Weekly maximal temperature change (°C) from baseline in male and female rats following weekly treatment with methylone (10 mg/kg, sc) for 5 wk. Each value is the mean ± SEM; n = 6. Significance of between group differences are denoted by asterisks; * = p < .05, ** = p < .01, *** = p < .001, while significant (p < 0.002) tolerance effects are denoted by †. Significant hypothermic effect is denoted by ¢.
Figure 3. qPCR gene expression analysis (Fold Change) of TGR5, UCP1, and UCP3 in (a) skeletal muscle and (b) brown adipose tissue following 6 wk of chronic methylone (10 mg/kg, sc) treatment of male (■) and female (□) rats. ** = male and female fold changes for that specific gene are significantly different from each other (p < 0.0004). ** = male and female fold changes for that specific gene are significantly different from each other (p < 0.0001). Each value is the mean ± SEM (n = 6).