
Figures & data
Figure 1. A simplified scheme of the PRFS phenomenon on atomic level. Left: A hydrogen atom in a water molecule is in an external magnetic field B0. The electron cloud of the water molecule induces an opposite magnetic field Bind which has considerably smaller magnitude than B0. The induced field reduces the effect of the external magnetic field on the hydrogen nucleus (the proton) hereby the local field experienced by the proton is: Bloc = B0 – Bind. The electron cloud thus causes a small shielding effect. However, the adjacent water molecules are attracted to each other by a hydrogen bond (green dotted line) which has an effect on the electron cloud. This causes a decrease of Bind and so reduces the shielding effect Right: As the temperature rises the hydrogen bonds stretch, bend, and break due to thermal motion and the hydrogen bond does not interfere the electron cloud as strongly anymore. Therefore, the shielding effect on the hydrogen nucleus increases and the local field is reduced
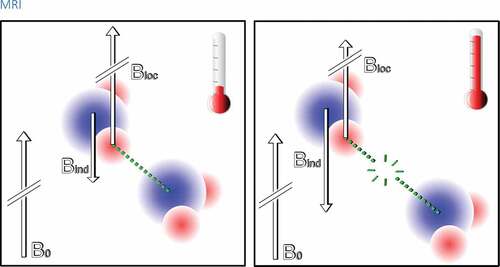
Figure 2. A color scaled PRF-based temperature map acquired using phase imaging from pelvic area during MRI-guided high-intensity focused ultrasound treatment of uterine fibroid. Maximum heating can be seen in the focal point of ultrasound beam at the center of uterine fibroid
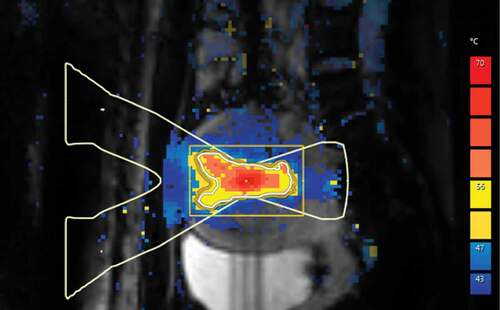
Figure 3. An example of the temperature dependence of the frequency difference between water and fat. A test tube containing 50 ml of margarine (fat content 82%, approximately the same as a mixture of white and brown adipocytes in human supraclavicular adipose tissue) was heated from 20°C to 32°C while MR spectra were measured from a single voxel (size: 10 × 10 x 30 mm3). Simultaneously an external thermometer was used for acquiring the temperature. Left: Few spectra at different phases of heating. Right: The frequency difference between water and methylene signal of fat plotted against temperature to show the correlation between the frequency difference and temperature. Reprinted with permission from [Citation13]
![Figure 3. An example of the temperature dependence of the frequency difference between water and fat. A test tube containing 50 ml of margarine (fat content 82%, approximately the same as a mixture of white and brown adipocytes in human supraclavicular adipose tissue) was heated from 20°C to 32°C while MR spectra were measured from a single voxel (size: 10 × 10 x 30 mm3). Simultaneously an external thermometer was used for acquiring the temperature. Left: Few spectra at different phases of heating. Right: The frequency difference between water and methylene signal of fat plotted against temperature to show the correlation between the frequency difference and temperature. Reprinted with permission from [Citation13]](/cms/asset/84c5f83b-3a88-46bd-8f76-00ef470cbb16/ktmp_a_1769006_f0003_oc.jpg)
Figure 4. The most important effects that temperature change has on ultrasound parameters. The change in the speed of sound appears as a shift of an echo, yet thermal expansion causes echo shifts as well [Citation139]. Attenuation arises from ultrasound absorption and scattering [Citation64]. The backscatter energy changes due to the change in the speed of sound and the density of sub-wavelength scatterers [Citation140]
![Figure 4. The most important effects that temperature change has on ultrasound parameters. The change in the speed of sound appears as a shift of an echo, yet thermal expansion causes echo shifts as well [Citation139]. Attenuation arises from ultrasound absorption and scattering [Citation64]. The backscatter energy changes due to the change in the speed of sound and the density of sub-wavelength scatterers [Citation140]](/cms/asset/c47842ba-9ecb-4d1b-aafb-85a915ae1805/ktmp_a_1769006_f0004_oc.jpg)
Figure 5. The density of an object affects directly how much radiation passes through the object
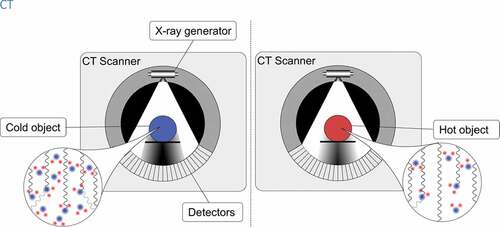
Figure 6. A simple demonstration where 300 ml of heated water was cooled down from 53°C to 33°C. During the cooling, a CT image was acquired every 2 minutes and the temperature of the sample was measured with an external thermometer. Top: CT images of the water at different phases of cooling. The color scale has been set from 1.2 to 10 HU. A non-colored image of the container has been set on the background. Bottom: CT-numbers plotted against the temperature to show the correlation between CT-number and temperature
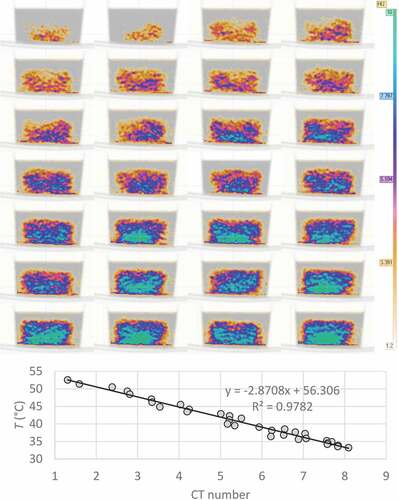
Figure 7. A near-infrared light source transmits light into the target tissue and an optical receiver detects the light reflected from the tissue. Tissue temperature can be estimated based on the temperature-dependence of the water absorption spectrum
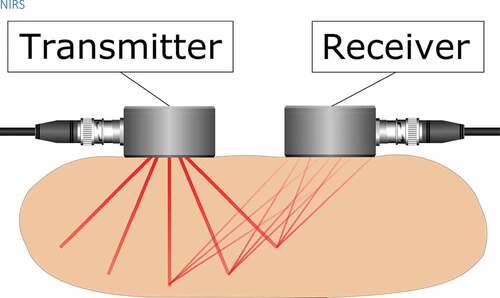
Figure 8. In microwave radiometry, a passive receiver measures the intensity of thermally generated microwave electromagnetic noise. The measurement depth can be altered by changing the frequency of the receiver as lower frequencies originate from deeper tissues
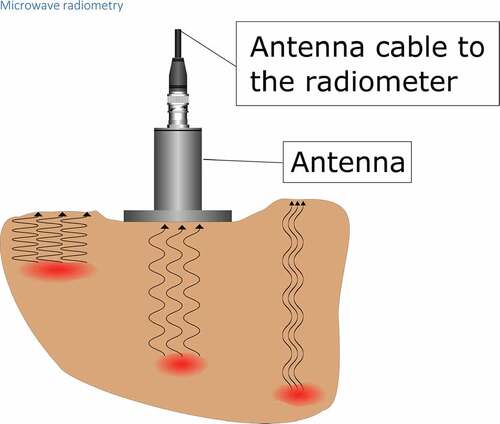
Figure 9. A pulsed laser light travels through tissue in which optically absorbing substance, such as hemoglobin absorbs the energy of the light. This makes the temperature of the object rise rapidly and the object experiences a thermoelastic expansion. This in turn creates a shockwave which travels through the tissue and can be detected at the surface with a piezoelectric sensor such as in an ultrasound transducer
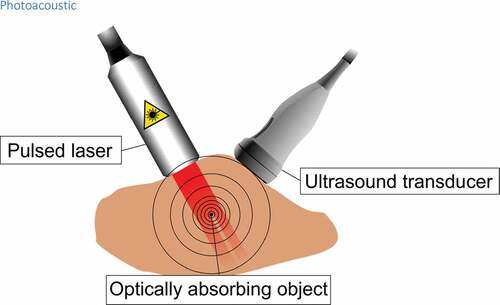
Table 1. Comparison of internal temperature imaging methods
Table 2. List of technical terms