Figures & data
Table 1. Individual characteristics of the 11 heat-sensitive MS patients tested in this study, along with their z scores and related absolute temperature values in °C for thermal thresholds (i.e. for both warm and cold and on both left and right side of the body); and z scores and related slope values for thermosensitivity. Proportions (%) of patients affected/showing thermosensory abnormalities are reported under each related column. Grey cells highlight z scores for abnormal thermosensory function (i.e. beyond ±1.96 standard deviation of the CTR group). Legend: Rx: right; Lx: left; RR: relapsing-remitting; PP: primary progressive; SP: secondary progressive
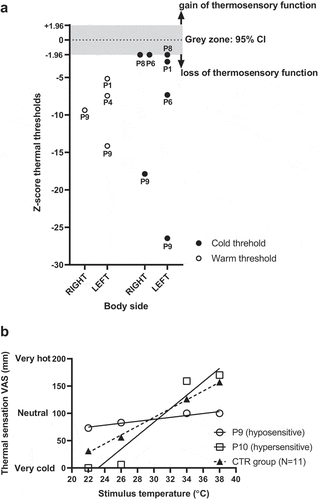
Figure 1. (a) Individual threshold z scores for both cold and warm temperatures and on the left and right side of the body for the 5 MS patients (i.e. P1,4,6,8,9) exhibiting thermosensory abnormalities. Patient number is reported for each value. The gray zone corresponds to the 95% CI of the CTR group, hence values above or below this band indicate a gain or a loss of function, respectively. (b) Thermosensitivity regression lines for the association between stimuli temperature and magnitude estimation, for the CTR group (N = 11) and for the 2 MS patients who exhibited abnormal sensitivity (i.e. slope z score beyond ±1.96 standard deviation of the CTR group)