1,812
Views
3
CrossRef citations to date
0
Altmetric
Research Paper

Human white-fat thermogenesis: Experimental and meta-analytic findings

ORCID Icon, , , , , , , , , , , , , , , ORCID Icon, ORCID Icon, ORCID Icon, ORCID Icon, & ORCID Icon show all
Pages 39-52 | Received 24 Mar 2020, Accepted 11 May 2020, Published online: 05 Jun 2020

Figures & data

Figure 1. Mean differences in uncoupling protein one (UCP1) mRNA expression and protein concentrations between cold (Dec 1-Mar 31) and warm (Apr 1-Nov 30) periods of the year (for the Northern hemisphere). *Significant differences. Values are presented as means and standard deviations
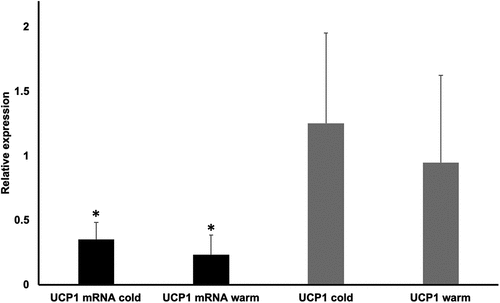
Figure 1. Mean differences in uncoupling protein one (UCP1) mRNA expression and protein concentrations between cold (Dec 1-Mar 31) and warm (Apr 1-Nov 30) periods of the year (for the Northern hemisphere). *Significant differences. Values are presented as means and standard deviations

Figure 2. Forest plot of main effect of cold exposure on uncoupling protein 1 (UCP1) mRNA expression in subcutaneous human white fat. SD: standard deviation; TWF: thigh white fat; AWF: abdominal white fat

Figure 2. Forest plot of main effect of cold exposure on uncoupling protein 1 (UCP1) mRNA expression in subcutaneous human white fat. SD: standard deviation; TWF: thigh white fat; AWF: abdominal white fat

Figure 3. PET/CT cooling protocol study; associations of SUVmax-WAT-activity with %fat mass (a) and body mass index (b)
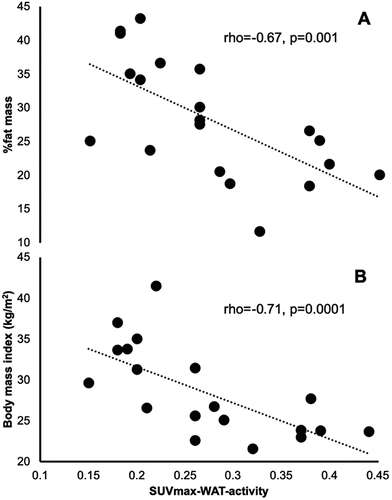
Figure 3. PET/CT cooling protocol study; associations of SUVmax-WAT-activity with %fat mass (a) and body mass index (b)

Figure 4. PET/CT non-cooling protocol study; associations of SUVmax with body mass index

Figure 4. PET/CT non-cooling protocol study; associations of SUVmax with body mass index

Figure 5. Forest plot of main effect of chronic exercise on uncoupling protein 1 (UCP1) expression in white fat of normal diet animals. SD: standard deviation; MIT: moderate-intensity training; HIIT: high-intensity interval training

Figure 5. Forest plot of main effect of chronic exercise on uncoupling protein 1 (UCP1) expression in white fat of normal diet animals. SD: standard deviation; MIT: moderate-intensity training; HIIT: high-intensity interval training

Figure 6. Forest plot of main effect of acute exercise on uncoupling protein 1 (UCP1) mRNA expression in white fat of normal diet animals. SD: standard deviation

Figure 6. Forest plot of main effect of acute exercise on uncoupling protein 1 (UCP1) mRNA expression in white fat of normal diet animals. SD: standard deviation
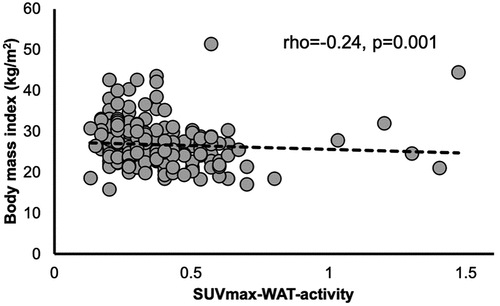
Figure 7. Forest plots of main effect of chronic exercise on uncoupling protein 1 (UCP1) expression in white fat of high-fat diet animals. SD: standard deviation; HFD: high-fat diet; L-C: L-carnosine

Figure 7. Forest plots of main effect of chronic exercise on uncoupling protein 1 (UCP1) expression in white fat of high-fat diet animals. SD: standard deviation; HFD: high-fat diet; L-C: L-carnosine
Supplemental material

Supplemental Material

Download MS Word (13.3 MB)