Figures & data
Figure 1. a: Oxygen consumption (L·min−1) and b: heart rate (b·min−1) at baseline (start) and during CON (■) and ECC (●) which were terminated at the equivalent time point (end exercise; +0.5°C increase in aural temperature during the ECC trial). † p < 0.05 CON v ECC during the period of cycling. *p < 0.05 CON v ECC trial at end exercise. Data are expressed as mean ± SD (n = 8)
Figure 2. a: Aural temperature (°C) b: mean skin temperature (°C) and C: mean body temperature (°C) at baseline (start) and during CON (■) and ECC (●) cycling which were terminated at the equivalent time point (end exercise; +0.5°C increase in aural temperature during the ECC trial). † p < 0.05 CON v ECC during the period of cycling. *p < 0.05 CON v ECC trial at end exercise. Data are expressed as mean ± SD (n = 8)
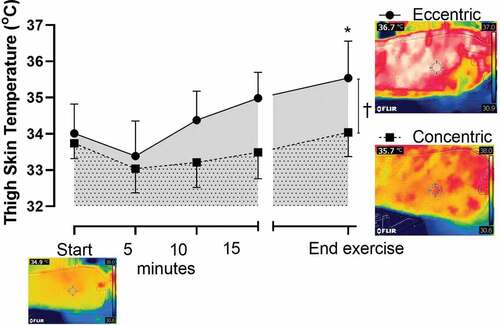
Figure 3. Thigh skin temperature (°C) at baseline (start) and during CON (■) and ECC (●) cycling terminating at the equivalent time point (end exercise; +0.5°C increase in aural temperature during the ECC trial). A representative thermal image (from one subject) at baseline (start) and equivalent time of termination (end exercise) for ECC and CON trials visually represents the elevated skin temperature directly above the contracting muscle. † p < 0.05 CON v ECC during the period of cycling. *p < 0.05 CON v ECC trial at end exercise. Data are expressed as mean ± SD (n = 8)