Figures & data
Figure 1. Experimental designs. * indicates the days at which the incremental-speed exercises were carried out. Legend: Exp, experiment; RSD, rapid eye movement sleep deprivation
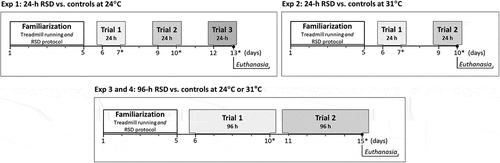
Table 1. Physical performance and thermoregulatory responses in control rats either kept in their home cages or on the grid and then subjected to an incremental exercise
Figure 2. Time to fatigue in rats subjected to 24-h rapid eye movement sleep deprivation (RSD) or the control procedure; physical exercise was performed at two ambient temperatures: 24°C or 31°C (panel A). The data are expressed as means ± SEM and were analyzed using two-way ANOVAs, followed by Tukey’s post hoc test. # denotes a significant (p < 0.05) main effect of ambient temperature. Panel B shows a small reduction in time to fatigue caused by RSD, irrespective of the ambient temperature. Panel C shows a large reduction in time to fatigue caused by the warm environment, irrespective of whether rats were or were not subjected to RSD
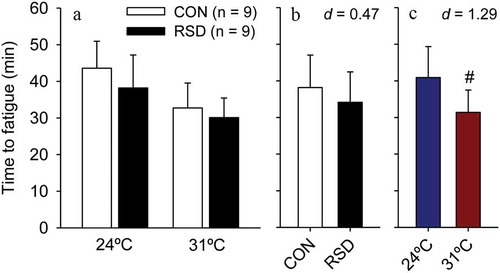
Figure 3. Changes in colonic temperature (panels A and B) and tail-skin temperature (panels C and D) induced by physical exercise at 24°C or 31°C in control rats (white circles) or rats subjected to 24-h rapid eye movement sleep deprivation (RSD, black circles). The temperature data are shown until the exercise time point when the first rat stopped running, whereas the scatter plots with bi-directional error bars indicate the temperatures measured at fatigue. The data are expressed as means ± SEM and were analyzed using three-way ANOVAs. These analyses yielded the following significant results, which are similar for both panels: treatment effect (p < 0.001) and interaction between the ambient temperature × time (p < 0.001). No other significant interactions were observed
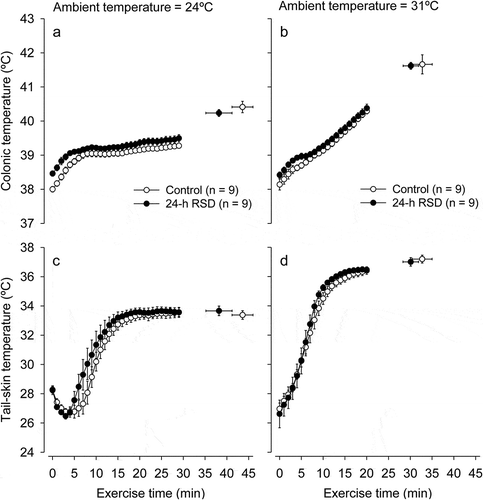
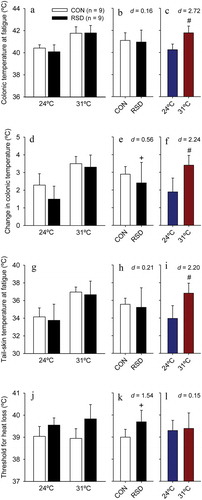
Figure 4. The colonic temperature at fatigue (panel A), exercise-induced changes in colonic temperature (panel D), the tail-skin temperature at fatigue (panel G), and colonic temperature threshold for cutaneous heat loss (panel J) in rats subjected to 24-h rapid eye movement sleep deprivation (RSD) or the control procedure; physical exercise was performed at two ambient temperatures: 24°C or 31°C. The data are expressed as means ± SEM and were analyzed using two-way ANOVAs, followed by Tukey’s post hoc test. + denotes a significant (p < 0.05) main effect of experimental group. # denotes a significant (p < 0.05) main effect of ambient temperature. The panels B, E, H, and K show the effect sizes of the changes induced by RSD, irrespective of the ambient temperature. The panels C, F, I, and L show the effect sizes of changes induced by the warm environment, irrespective of whether rats were or were not subjected to RSD
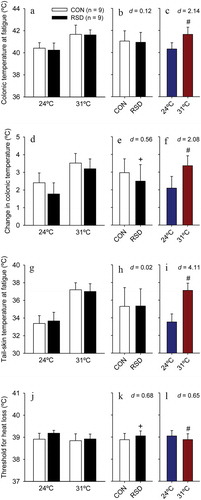
Figure 5. Time to fatigue in rats subjected to 96-h rapid eye movement sleep deprivation (RSD) or the control procedure; physical exercise was performed at two ambient temperatures: 24°C or 31°C (panel A). The data are expressed as means ± SEM and were analyzed using two-way ANOVAs, followed by Tukey’s post hoc test. # denotes a significant (p < 0.05) main effect of ambient temperature. Panel B shows a small reduction in time to fatigue caused by RSD, irrespective of the ambient temperature. Panel C shows a large reduction in time to fatigue caused by the warm environment, irrespective of whether rats were or were not subjected to RSD
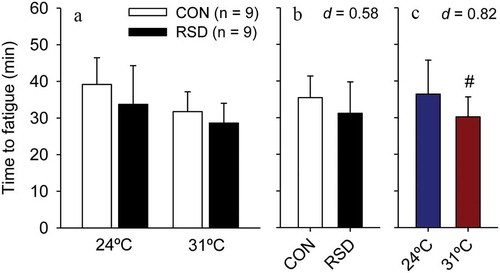
Figure 6. Changes in colonic temperature (panels A and B) and tail-skin temperature (panels C and D) induced by physical exercise at 24°C and 31°C in control rats (white circles) or rats subjected to 96-h rapid eye movement sleep deprivation (RSD, black circles). The temperature data are shown until the exercise time point when the first rat stopped running, whereas the scatter plots with bi-directional error bars indicate the temperatures measured at fatigue. The data are expressed as means ± SEM and were analyzed using three-way ANOVAs. These analyses yielded the following significant results, which are similar for both panels: treatment effect (p < 0.001) and interaction between the ambient temperature × time (p < 0.001). A significant interaction between ambient temperature × treatment (p = 0.014) was only observed for tail-skin temperature. No other significant interactions were observed
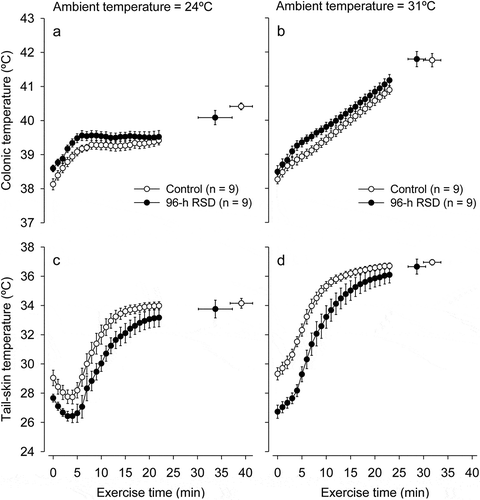
Figure 7. The colonic temperature at fatigue (panel A), exercise-induced changes in colonic temperature (panel D), the tail-skin temperature at fatigue (panel G), and colonic temperature threshold for cutaneous heat loss (panel J) in rats subjected to 96-h rapid eye movement sleep deprivation (RSD) or the control procedure; physical exercise was performed at two ambient temperatures: 24°C or 31°C. The data are expressed as means ± SEM and were analyzed using two-way ANOVAs, followed by Tukey’s post hoc test. + denotes a significant (p < 0.05) main effect of experimental group. # denotes a significant (p < 0.05) main effect of ambient temperature. The panels B, E, H, and K show the effect sizes of changes induced by RSD, irrespective of the ambient temperature. The panels C, F, I, and L show the effect sizes of changes induced by the warm environment, irrespective of whether rats were or were not subjected to RSD