Figures & data
Table 1. Checklist to ensure correct use of NCIT for tracking human core temperature
Figure 1. Two 10-year-old males, the top thermogram (a) shows a healthy (non-febrile) case. The bottom thermogram (b) shows a case of fever. Thermogram A shows a max temperature of 35°C at the inner eye-canthus. Thermogram B shows a max temperature of 38.6°C at the inner eye-canthus. Figure adapted with permission of QIRT Council [Citation24]
![Figure 1. Two 10-year-old males, the top thermogram (a) shows a healthy (non-febrile) case. The bottom thermogram (b) shows a case of fever. Thermogram A shows a max temperature of 35°C at the inner eye-canthus. Thermogram B shows a max temperature of 38.6°C at the inner eye-canthus. Figure adapted with permission of QIRT Council [Citation24]](/cms/asset/36f29922-9a0c-42e3-83ee-a50444127d96/ktmp_a_1899546_f0001_oc.jpg)
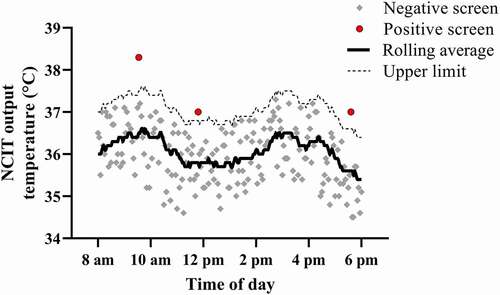
Figure 2. Simulated data to show the relative temperature screening method. A rolling average (solid black line) of all data points is used as the reference temperature. A temperature threshold of 1°C above this rolling average (dashed line) would result in a positive temperature screen, as shown by the red circular symbols. All data points below this threshold (gray symbols) would screen negative