Figures & data
Table 1. Mean ± SD of volume and intensity metrics for all matches and for each condition (COOL, WARM, HOT, and VHOT).
Figure 1. Panel of scatter plots demonstrating the relationship between temperature and volume (panels a-d) and intensity (panels e-h) metrics.
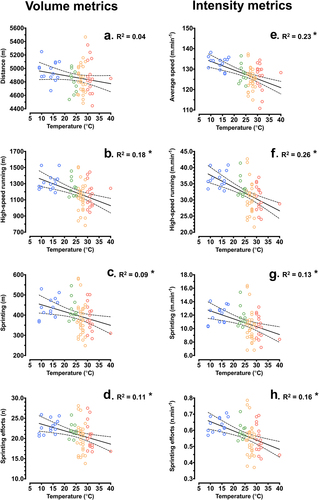
Figure 2. Mean ± SD panel of selected volume (panels B&C) and intensity (panels D-I) metrics depicting responses across conditions (COOL, WARM, HOT, VHOT).
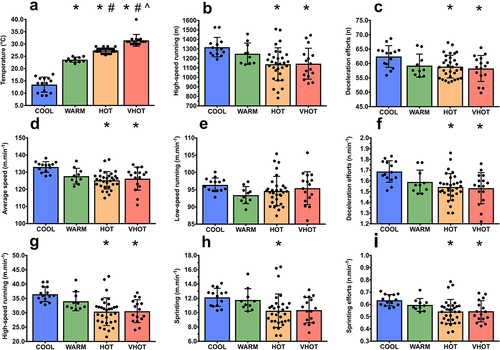
Figure 3. Summary figure outlining the change (%) in volume (a) and intensity (b) metrics in COOL, WARM, HOT and VHOT from the group mean.
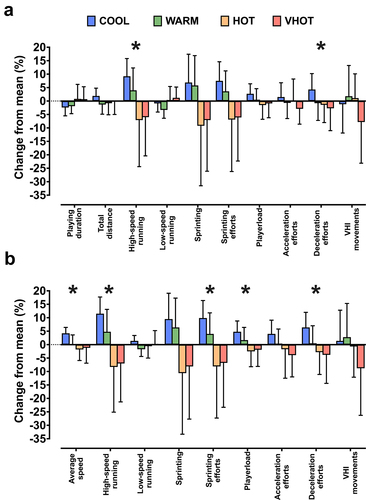
Figure 4. Mean ± SD panel of positional responses across conditions (COOL, WARM, HOT, VHOT).
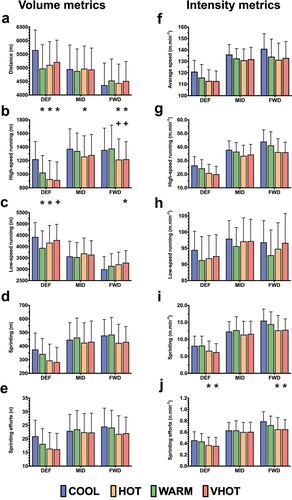
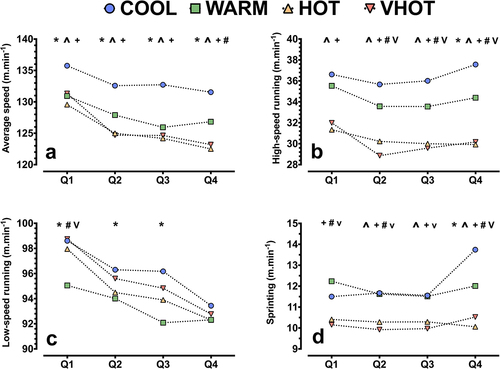
Figure 5. Panel of A – average speed (m.min−1), B – high speed running (m.min−1), C – low speed running (m.min−1), and D – sprinting distance (m.min−1) responses across playing quarters and conditions (circle = COOL, square = WARM, triangle = HOT, nabla = VHOT). Error bars removed for clarity.