Figures & data
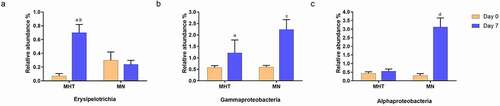
Figure 1. Study design. Animals were treated once a week with either saline or methylone (10 mg/kg, sc). Tolerance to the hyperthermia induced by methylone was seen after the fourth week of treatment and the FMT between the treatment groups occurred in the 4th and 5th week time period. Following the one week FMT period, a final dose of methylone was given and temperature monitored in 30 minute intervals for a total of 90 minutes before tissue collection. This figure was generated using BioRender.
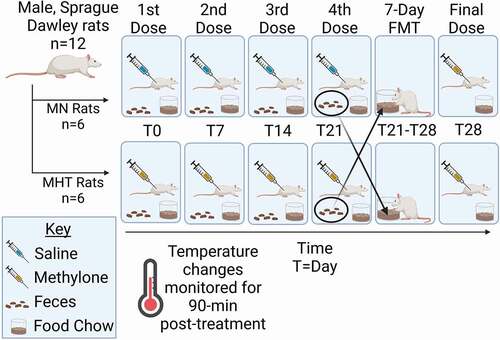
Figure 2. Maximal temperature associated with once-a-week dosing of methylone (10 mg/kg, sc). (a) Weekly maximal temperature changes. “FMT” bar between weeks four and five indicates the duration of the fecal microbial transplant between treatments. *indicates significant difference between each week’s maximal temperature change between the MHT and MN group (p < 0.001). ϕ indicates significantly different from MHT maximal temperature change week 1 (p < 0.01). Each value is the average ± SEM (n = 6). (b) Individual animal maximal temperature changes over the five week treatment period. The horizontal black line indicates the median for the MHT group, and the red line is the median for the MN group.
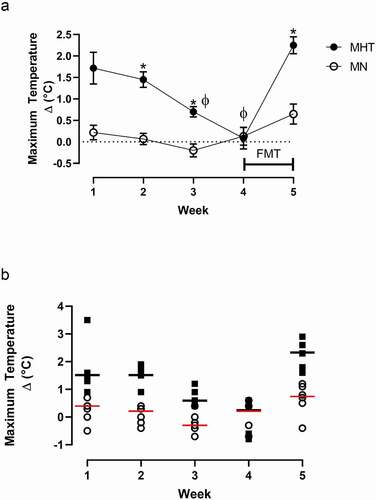
Figure 3. (a) NE plasma concentrations (pg/µL) for MHT and MN rats following the fifth dose (once a week) of methylone (10 mg/kg, sc) in the MHT group and a single dose of methylone in the MN group. Each value is the average ± SEM (n = 6). *indicates significant differences from MHT group (p = 0.008). (b) Linear correlation between individual plasma NE levels and maximal temperature changes following methylone treatment.
Figure 4. (a) Relative mRNA expression of TGR5, UCP1 and UCP3 was measured by qRT-PCR of MHT group compared to MN group in brown adipose tissue (BAT) and (b) in the skeletal muscle (SKM). β-actin was used as a normalization control. Expression of UCP1 in SKM was below the level of detection. Each bar represents the mean ± SEM of pooled samples ran in quadruplicate (BAT) or triplicate (SKM). Statistical analysis was performed with Wilcoxon non-parametric test (p < 0.05). * indicates significant differences of relative gene expression.
Figure 5. Principal coordinate analysis (weighted, UniFrac; p = 0.019) of overall microbiome composition pre- and post-FMT. Colored circles represent the microbiome of an individual at the 95% confidence interval, with the group membership identified by color, as indicated in the key, where; “MN day 0” (Orange circles) represents untreated control animals prior to FMT, “MN day 7” (green circles) represents untreated control animals following to FMT, “MHT day 0” (blue circles) represents methylone tolerant animals prior to FMT and “MHT day 7” (purple circles) represents methylone tolerant animals following to FMT. Ellipses are added to highlight each experimental group.
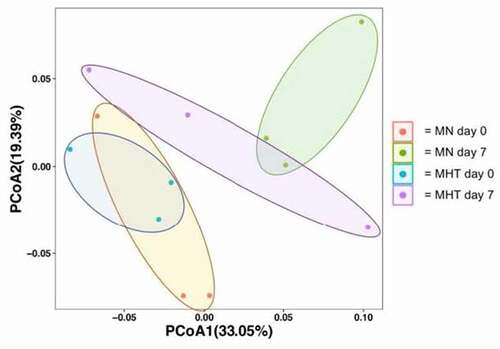
Figure 6. Stacked barplot of the five most abundant bacterial classes identified for individual animals prior to (“0”) and following (“7”) FMT, with classes identified by color, as indicated by the key at the right. The phylum of each class is listed in parentheses. Methylone hyperthermia-tolerant (MHT) and methylone-naive (MN) animals are identified by number.
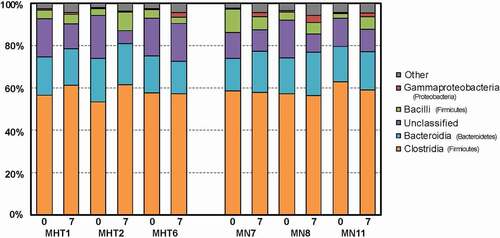
Figure 7. Mean relative percentage of microbiota as the class Erysipelotrichia (a), Gammaproteobacteria (b) and Alphaproteobacteria (c) pre- (day 0) and post- (day 7) FMT. aindicates significantly different than MHT day 0 (p < 0.05); bindicates significantly different than MN day 7 (p < 0.05); cindicates significantly different than MN day 0 (p < 0.05); dindicates significantly different than all other groups (p < 0.001). Each value is the mean ± SEM (n = 3).